
3D Site Plan
Buyers picked a flat from page after page of units in a grid. With a colleague I tested an interactive 3D site plan against it: twelve people, two groups of six.
- BI Group
- Product designer. Co-ran both research rounds with a colleague
- A/B study, post-launch feedback, the client 3D plan, the markup tool
- 2025
- Redrawn in 2026 for this case, with demo data. Both tools are live.
Impact · Outcome
A month after launch, the same six agents said the plan shortens a consultation
Before launch, a colleague and I tested an interactive 3D site plan against BI Group's existing listing page. The group on the plan found the flat faster, and 83% of it found the plan clear; on the grid, 66% of the buyers said the unit grid wasn't clear. Agents answered for the interface they had used: the ones on the grid said the grid was easier for them, and the ones on the plan said they would use it with clients.
It shipped for buyers, together with a tool colleagues use to mark the plan up. A month after launch we went back to the same six agents, three from each group, and all six said it shortens a client consultation.
From those comments, the head of sales and the agents projected that the plan could save agents up to about 33 hours of consultation time a day at the Viva Plaza sales office. That is their estimate, not a measurement.
Context
Choosing a home from a grid of cells
BI Group's listing page showed flats as tiles or as a unit grid: cells by floor and line, page after page of them. A buyer meets it once, while making one of the largest purchases of their life, and has to work out from a cell where the flat actually is.
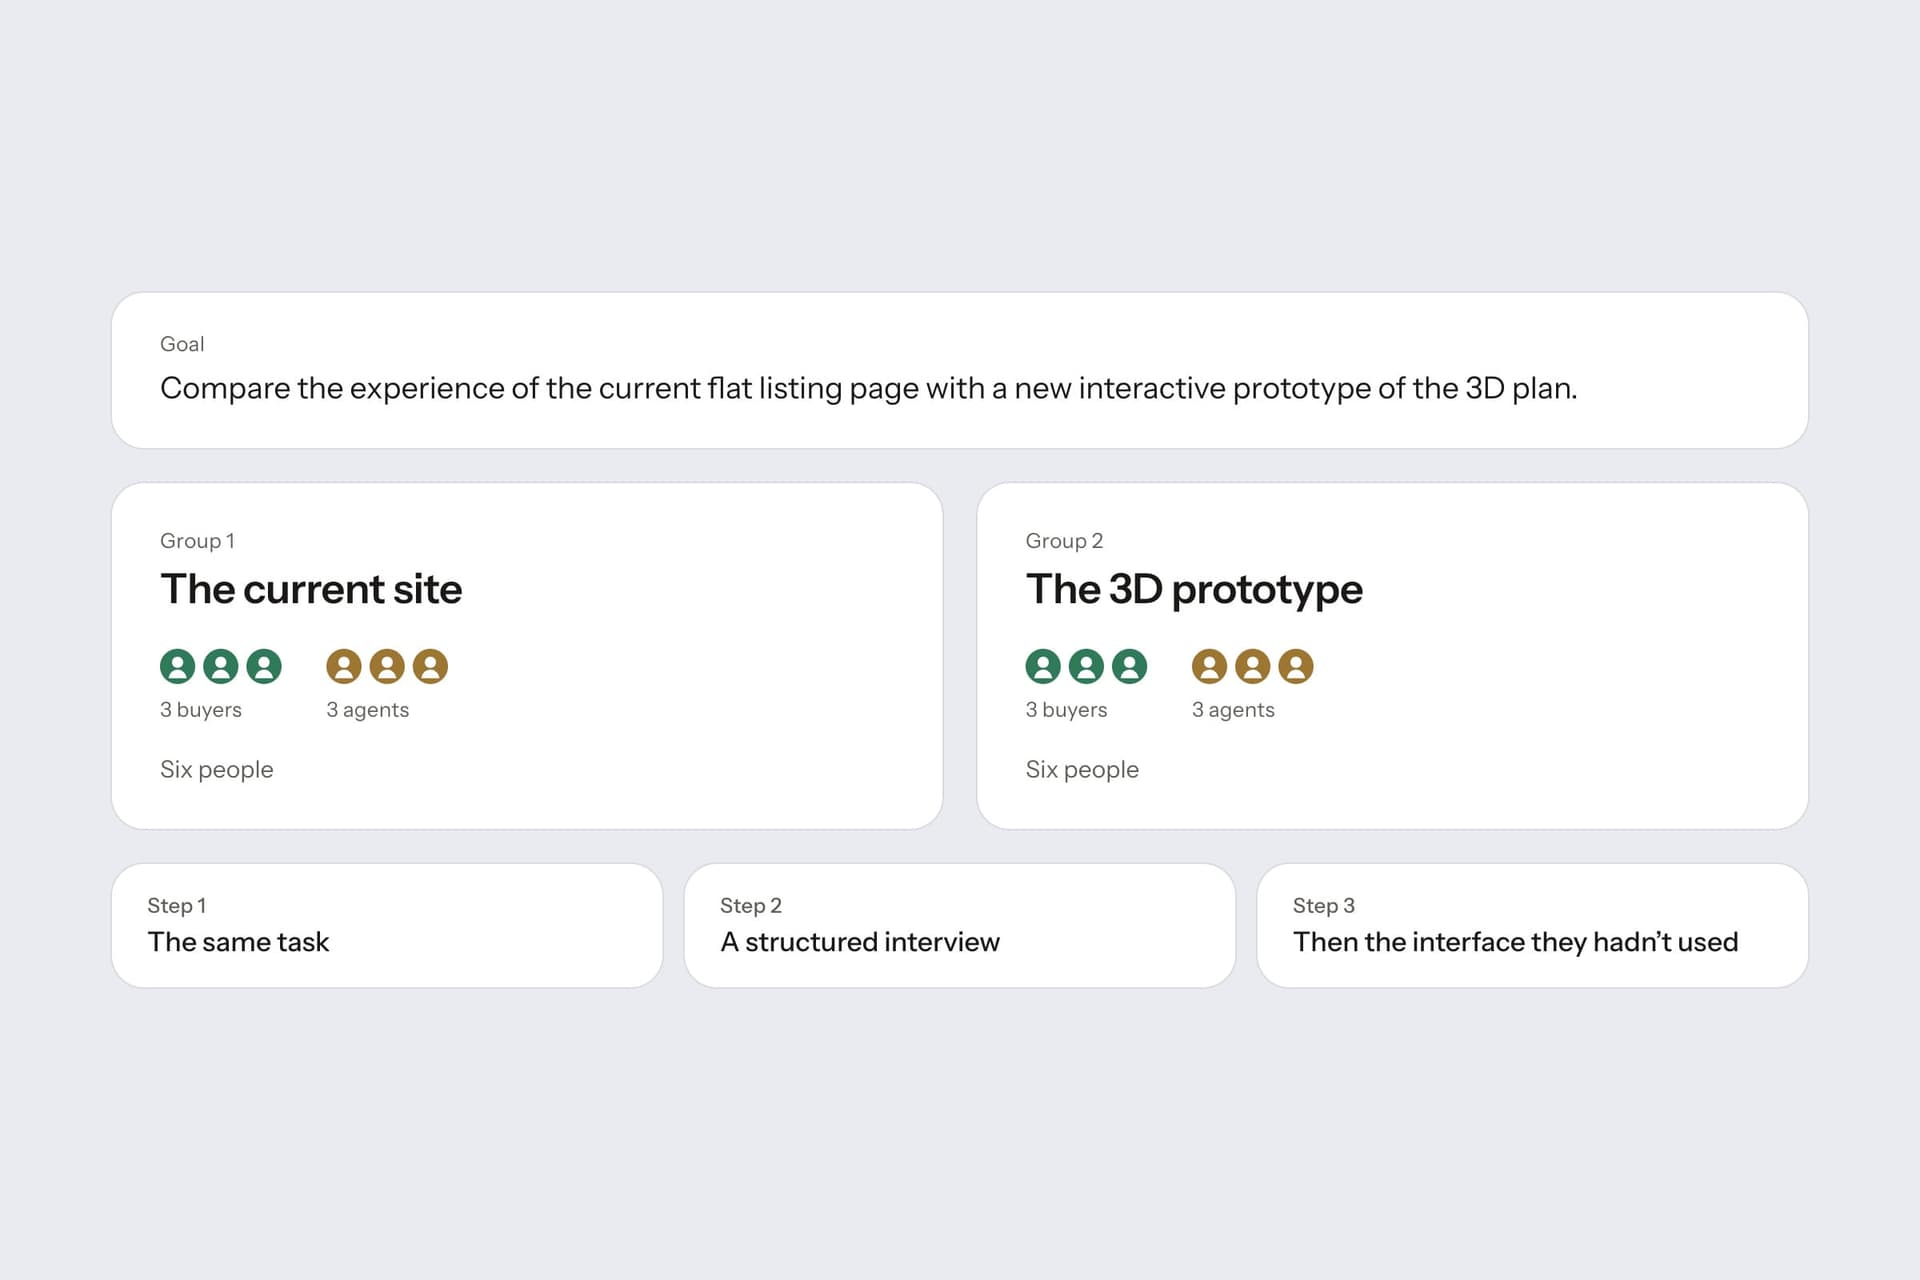
The proposal was an interactive 3D site plan: start from a render of the development and click down to a flat. Before building it, we tested a prototype against the live page with two groups of six, three buyers and three agents in each. Each group used one interface.
Discover · Method
One task, then an interview
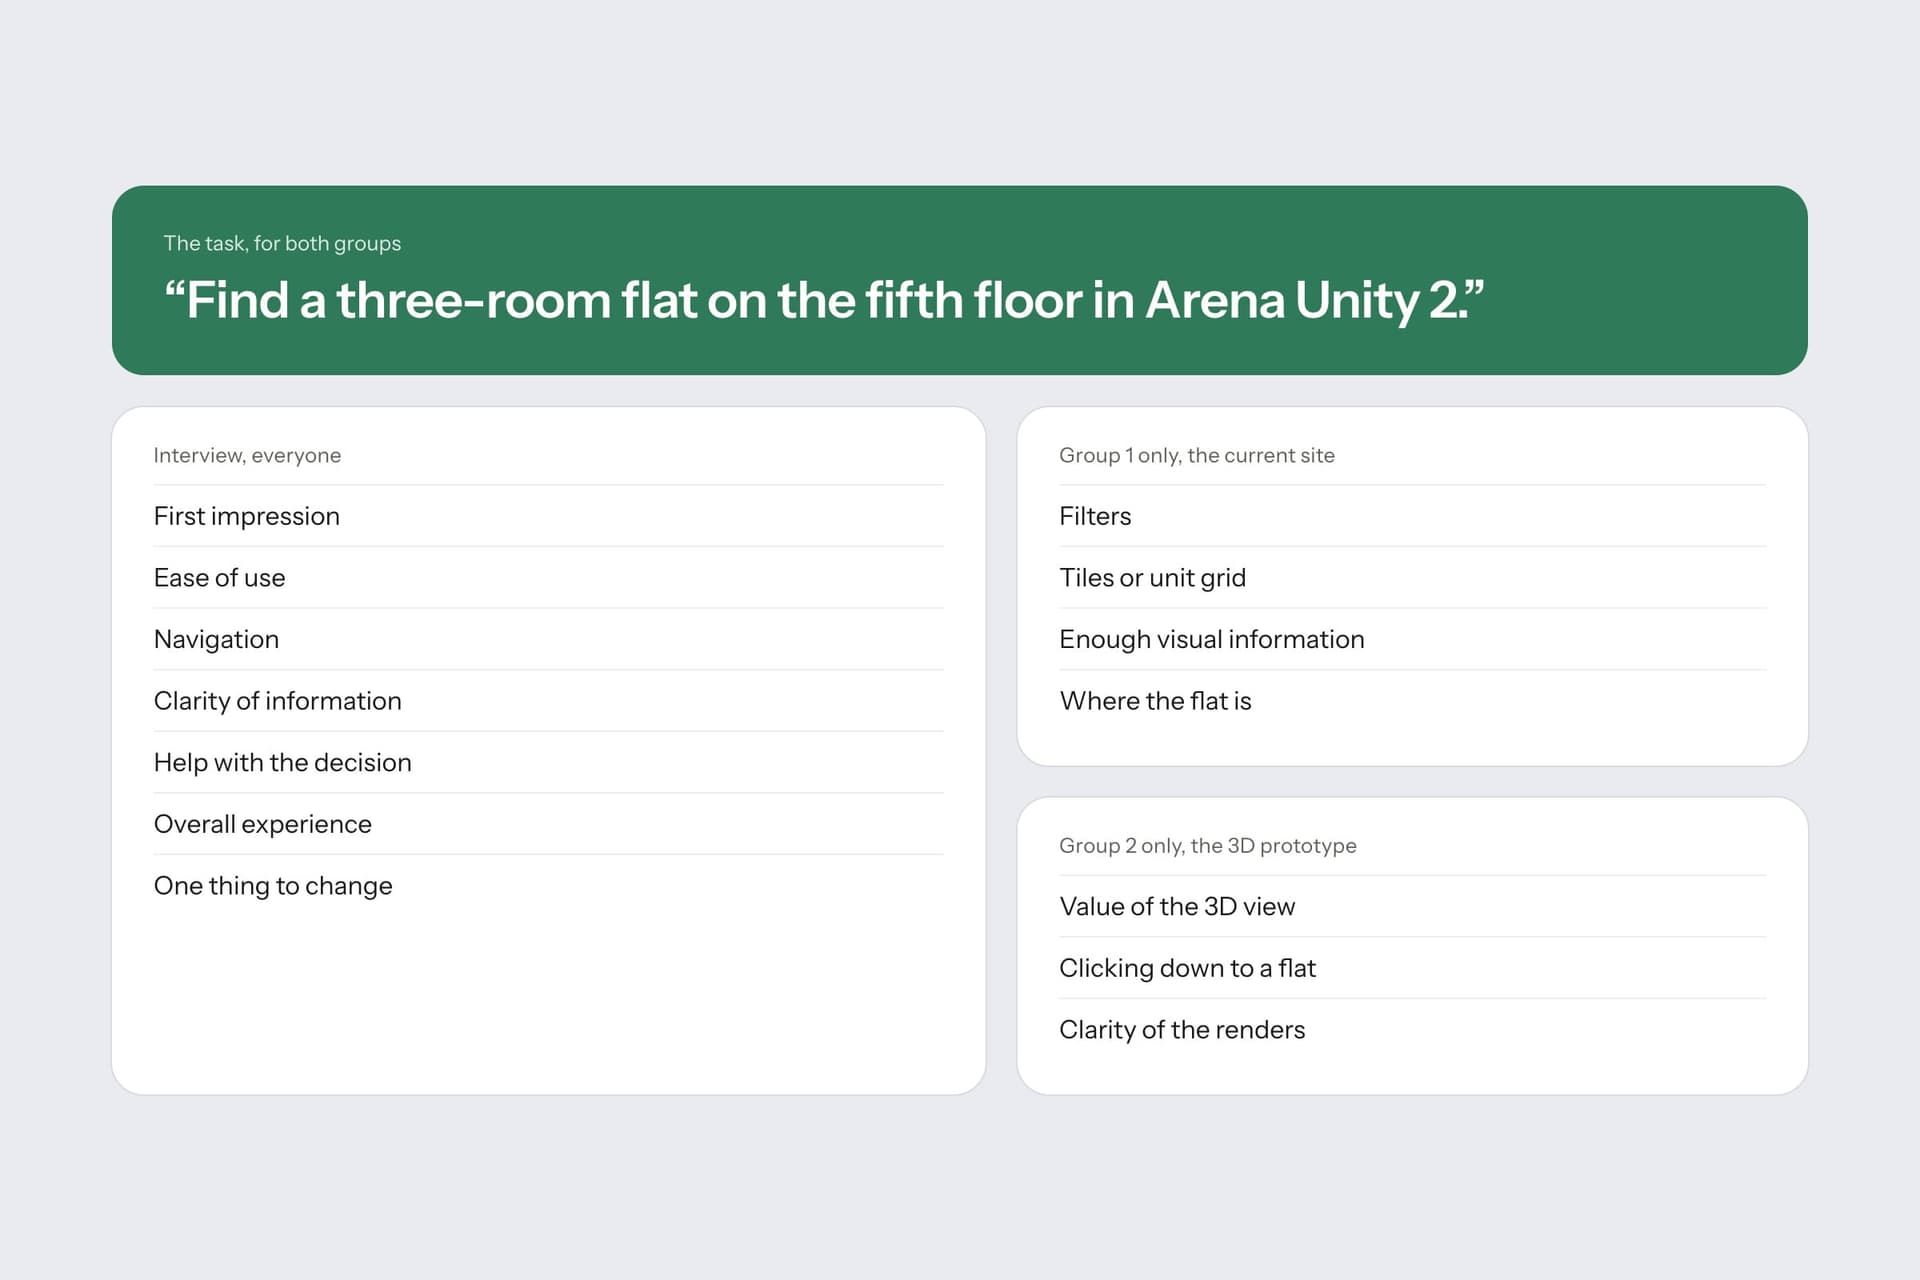
Both groups got the same task: find a three-room flat on the fifth floor in Arena Unity 2. Then a structured interview about first impressions, ease of use, navigation, how clear the information was, and whether it helped them decide.
Each group also had its own questions. The grid group was asked about filters, tiles against the unit grid, and whether they could tell where the flat was. The 3D group was asked what the 3D view added, how clicking down to a flat felt, and how clear the renders were. At the end, everyone was shown the interface they hadn't used.
Discover · Results
Buyers and agents wanted different things
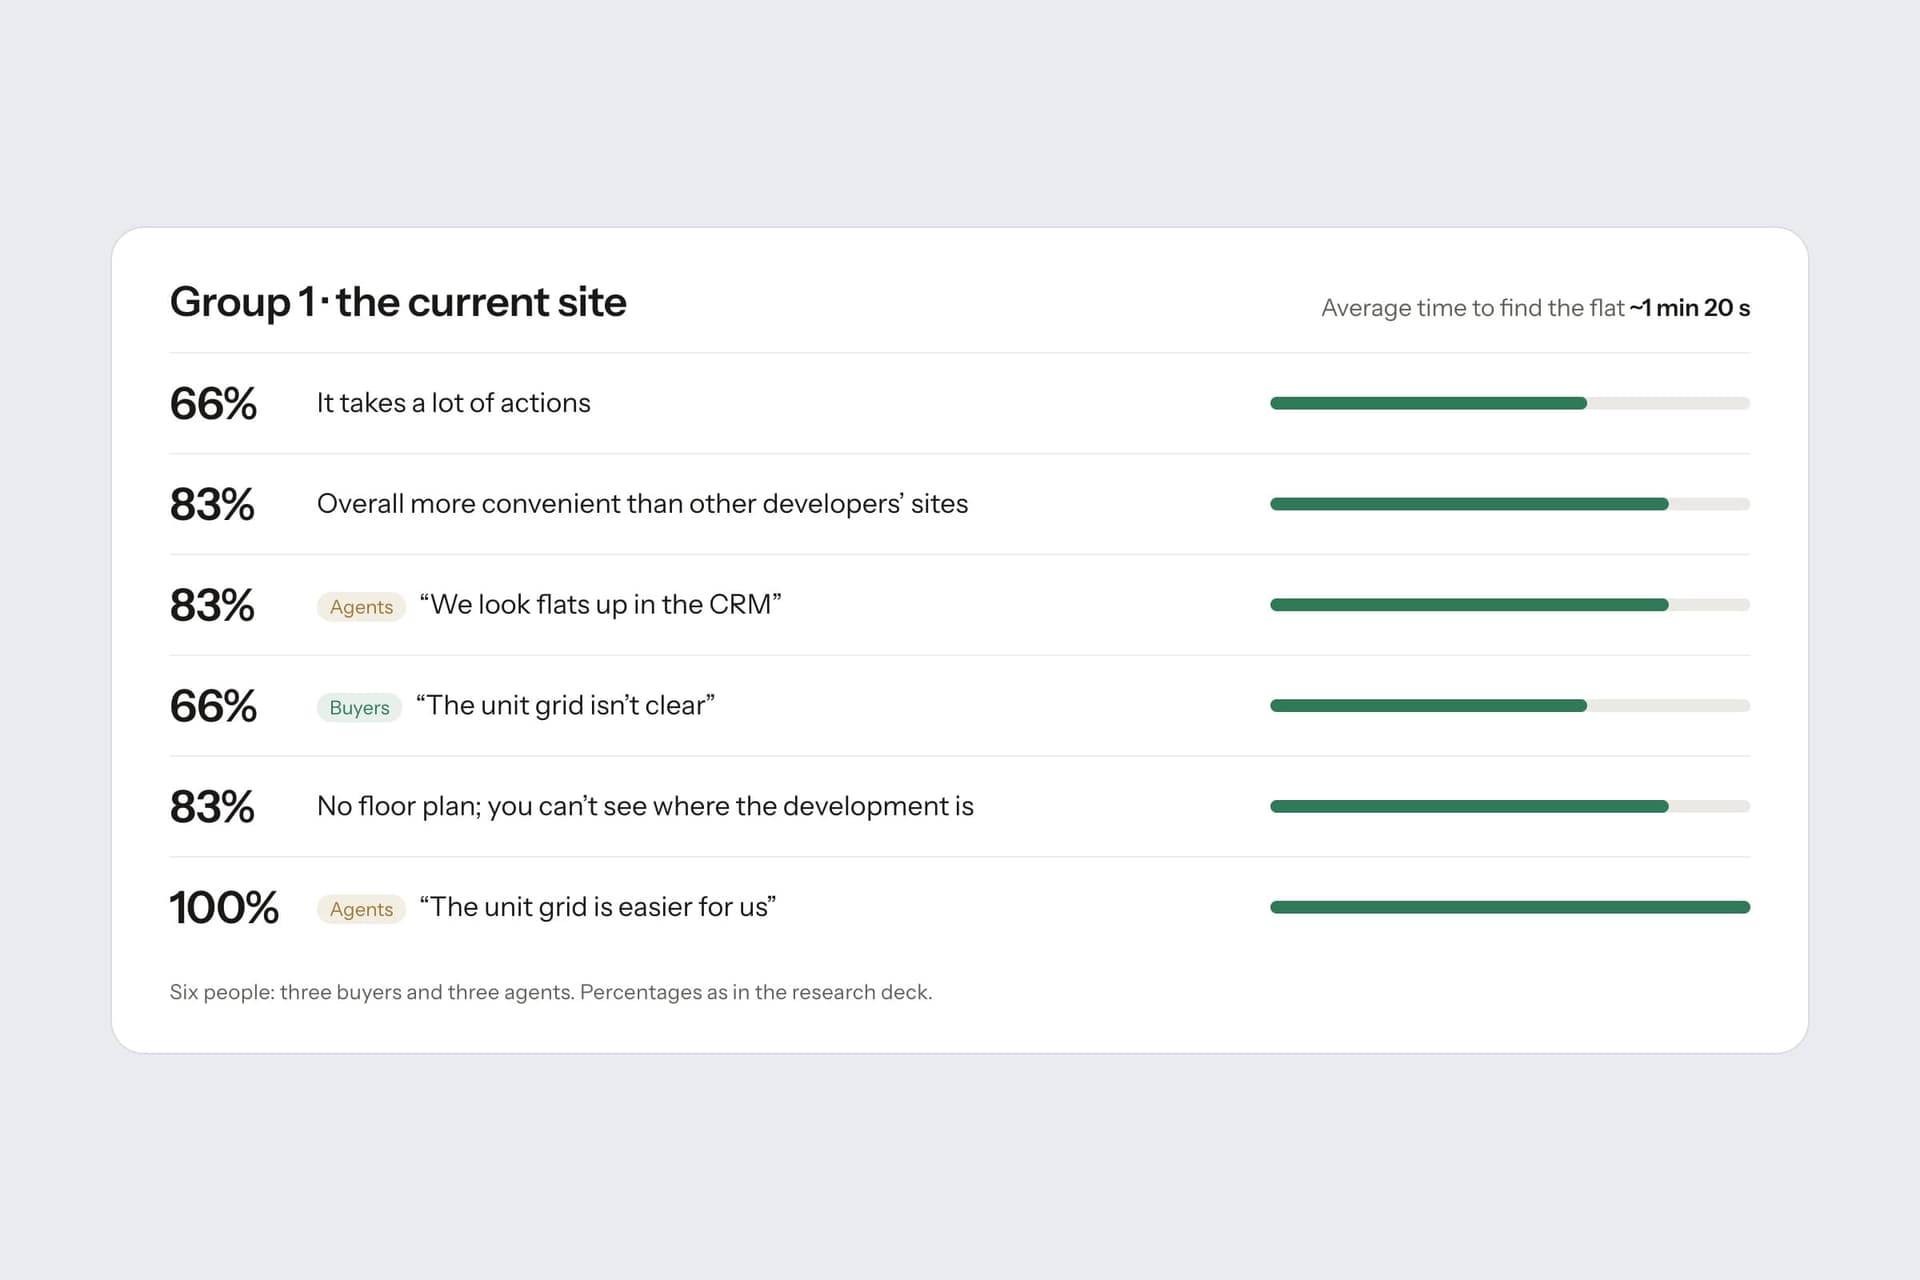
The numbers below are the research deck's percentages: some answers came from the whole group, some from its buyers or agents only.
Group 1, the current site
Finding the flat took about 1 min 20 s on average. 66% said it took a lot of actions, 83% that there was no floor plan and no sense of where the development was, and 66% of the buyers said the unit grid wasn't clear. 83% still found the site more convenient overall than other developers'.
The agents read it differently. 100% said the unit grid was easier for them, and 83% said they look flats up in the CRM anyway.
Group 2, the 3D prototype
About a minute on average. 83% found it clear and the process more interesting, 83% could see what the development would look like, and 83% called it a very useful tool. 66% of the agents said a client can see which way the windows face, and 66% said they would use it instead of the CRM to show a client during a consultation.
83% asked for streets and landmarks on the render. That request came back after launch.
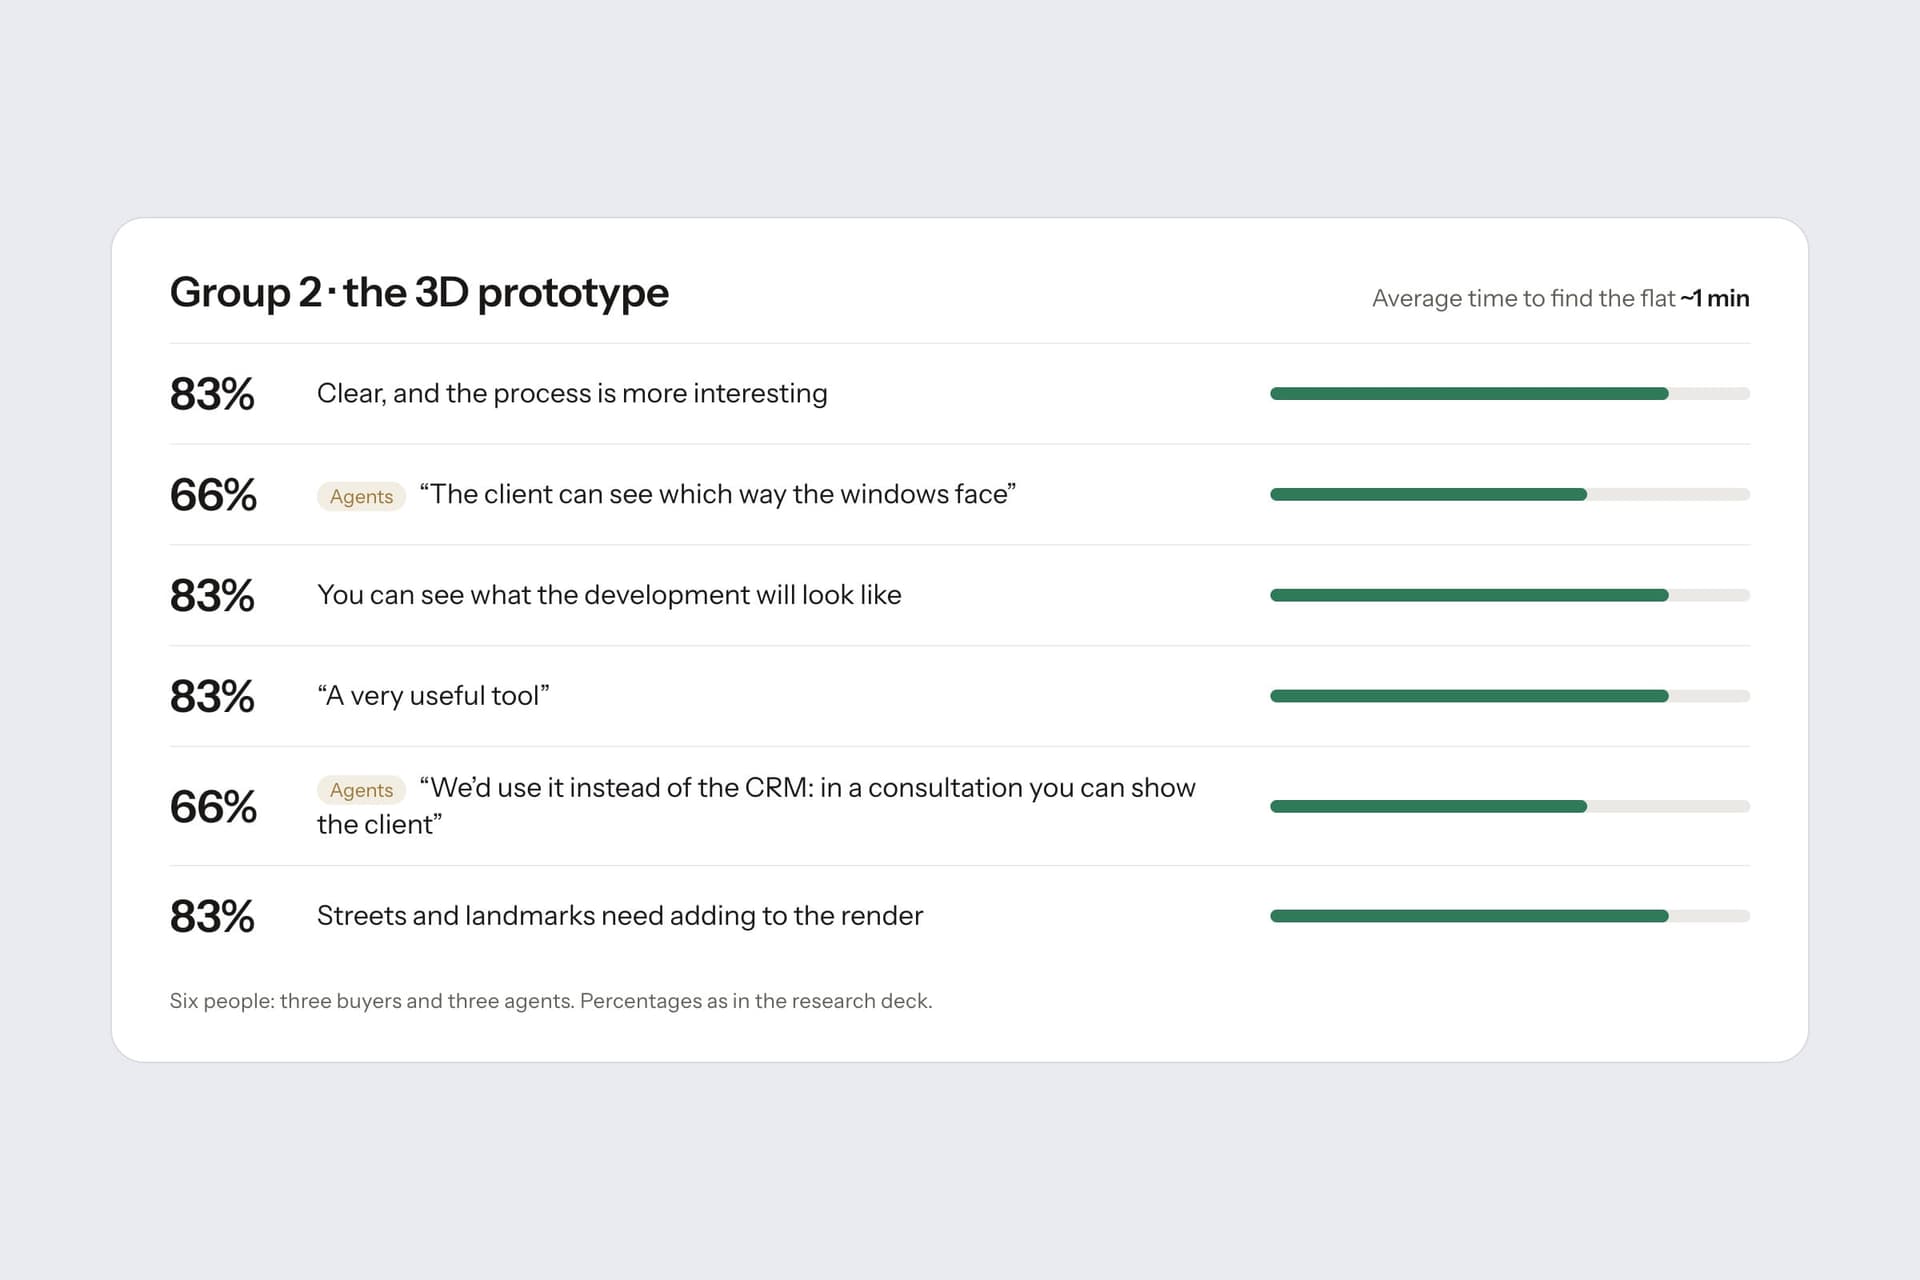
Agents know the stock, and a grid is the fastest way to a number they already have in mind. Buyers are trying to picture a building that doesn't exist yet. Each group of agents answered for the interface in front of them, and the plan was built for the buyers.
Define · Develop · The 3D plan
Building, entrance, floor, flat
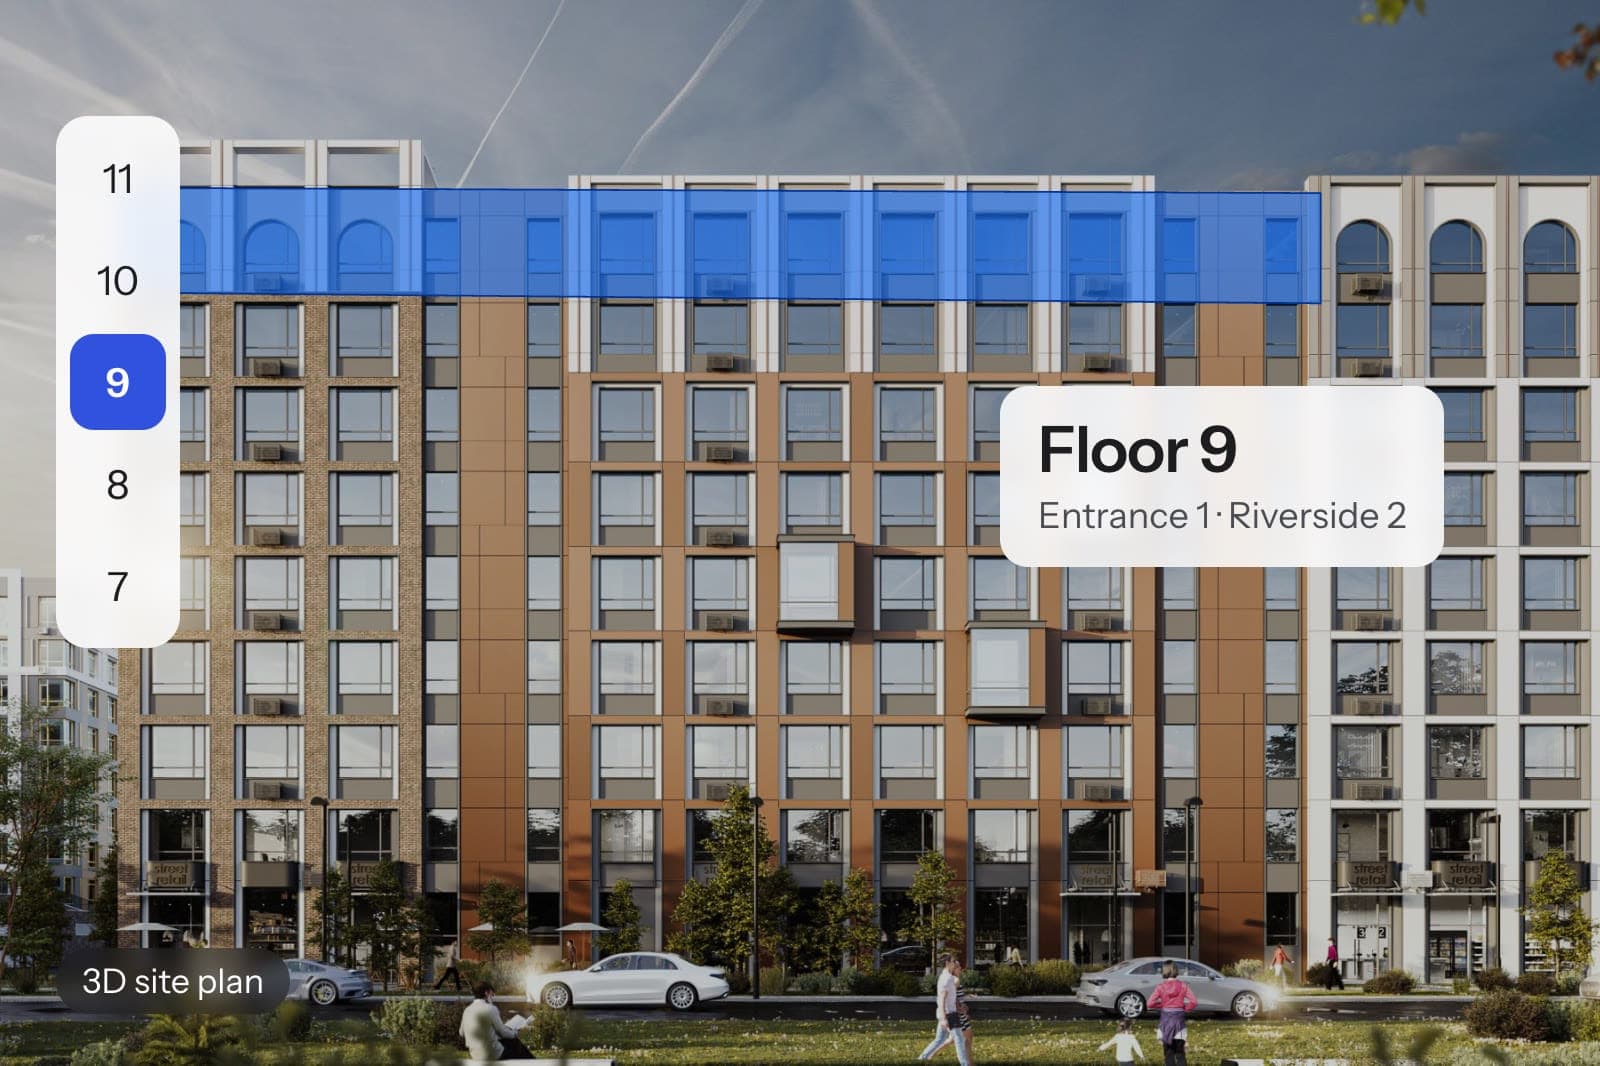
The findings set the shape of the plan. On the old page a buyer paged through unit after unit and picked one from a cell. On the plan they go down four steps on the render, and each step answers something the groups told us.
The building
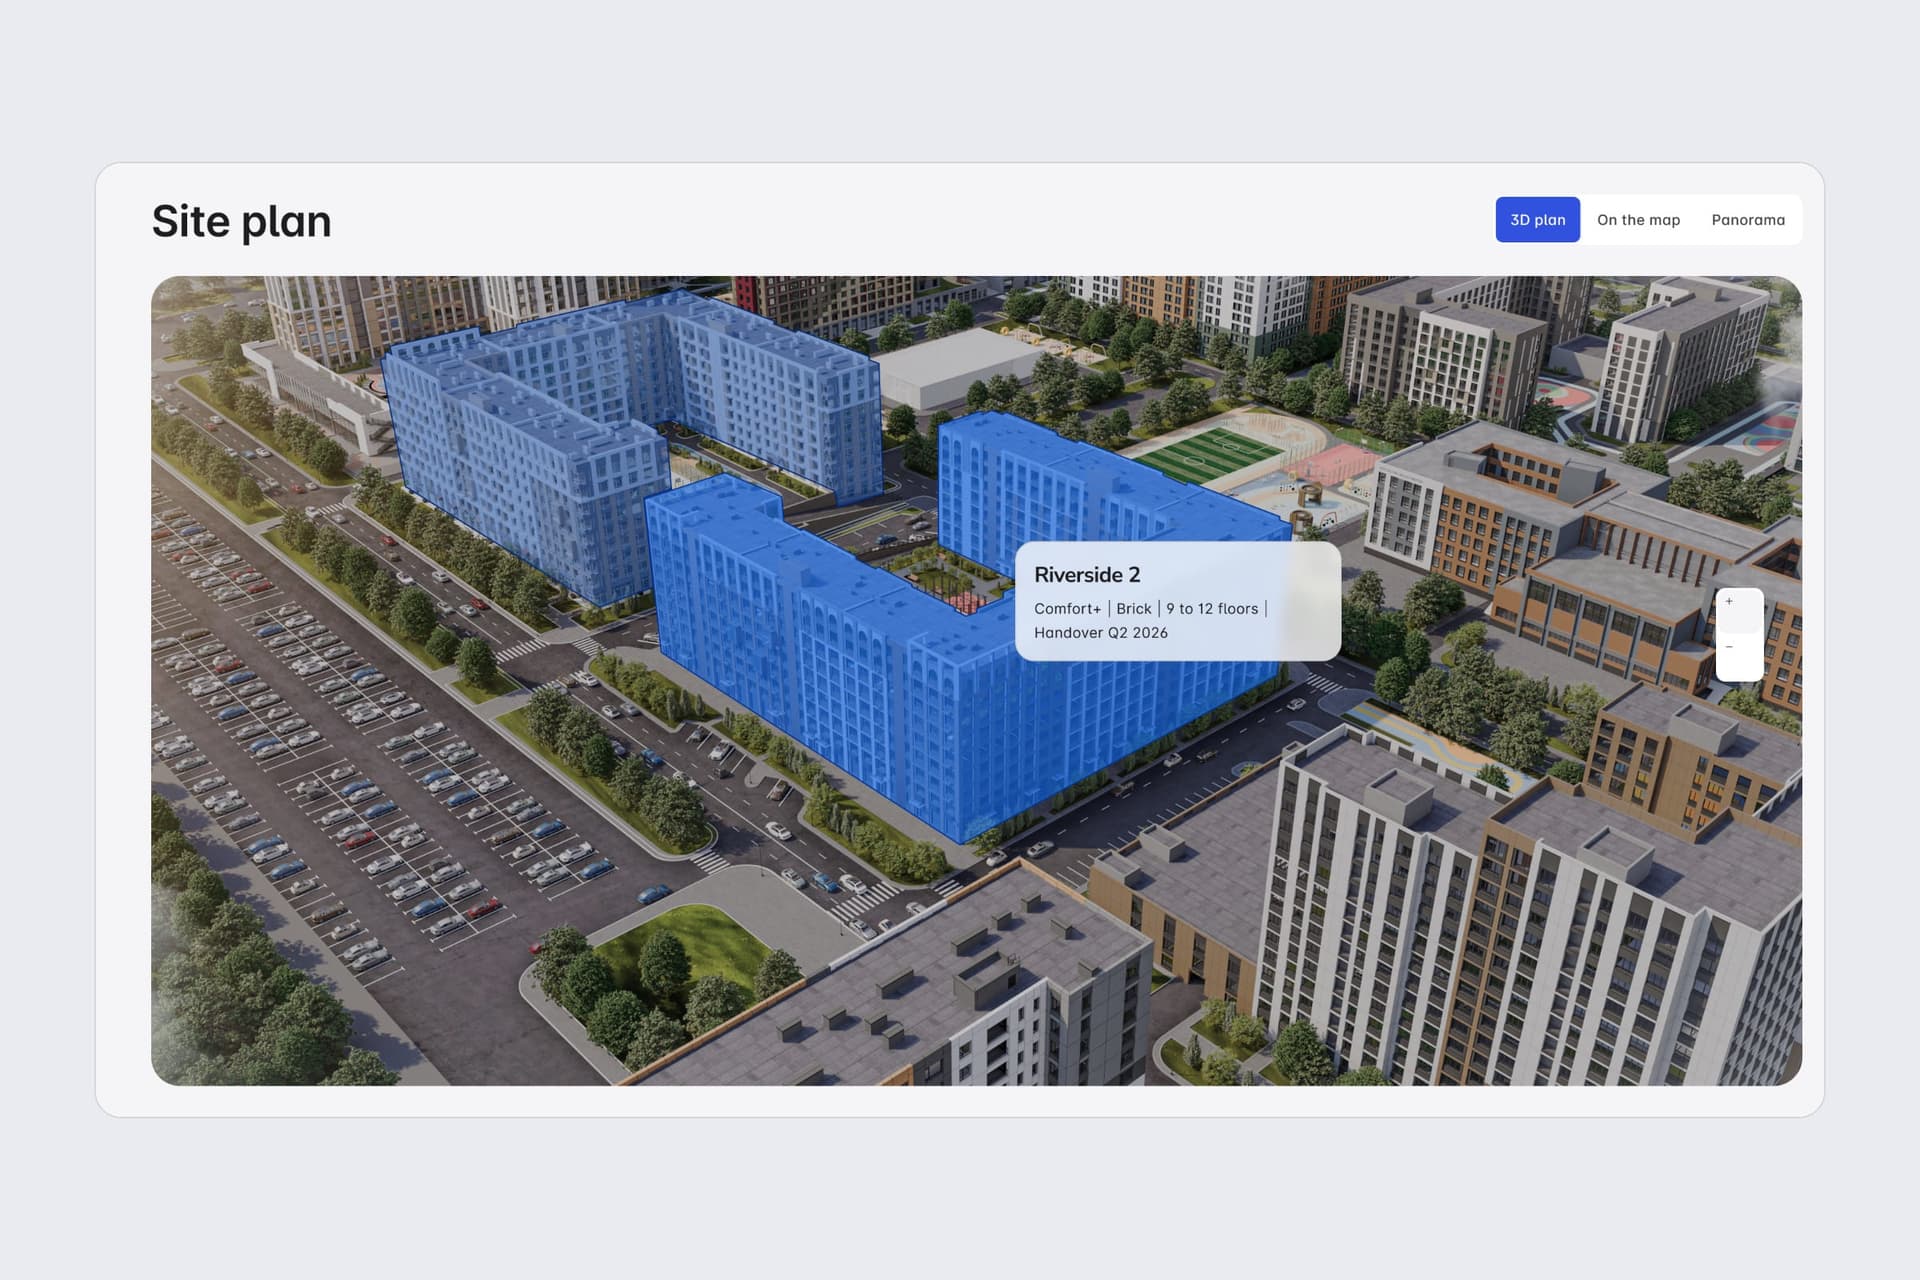
83% of the grid group said they couldn't see where the development was. So the plan opens on the render of the whole site, with each building outlined. Pointing at one shows its name, class, number of floors and handover date. In the 3D group, 83% said they could see what the development would look like.
The entrance
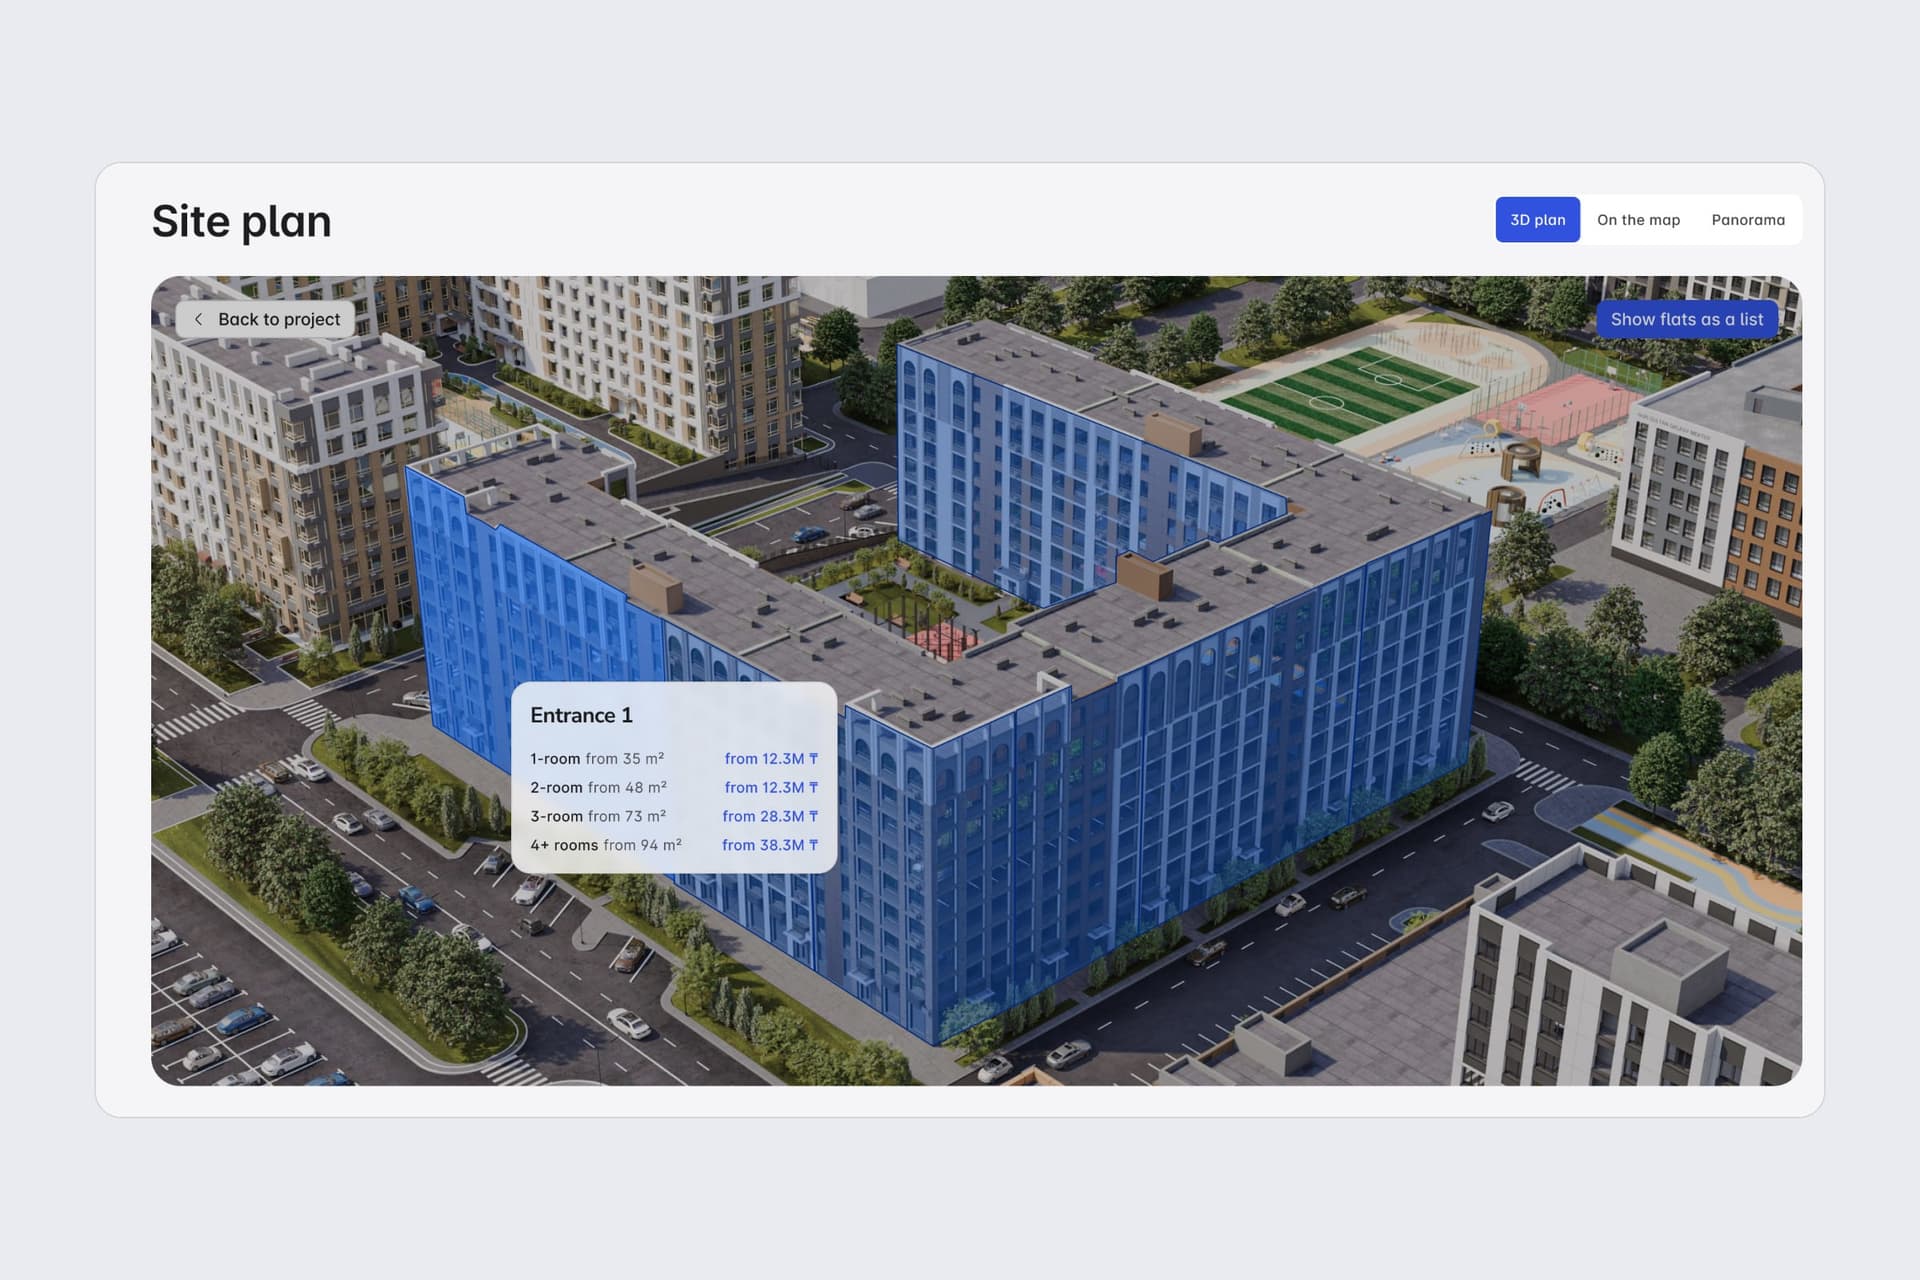
66% of the grid group said it took a lot of actions. Here one click on a building shows its entrances, each with prices by flat size, and the buyer narrows down without leaving the picture.
The floor
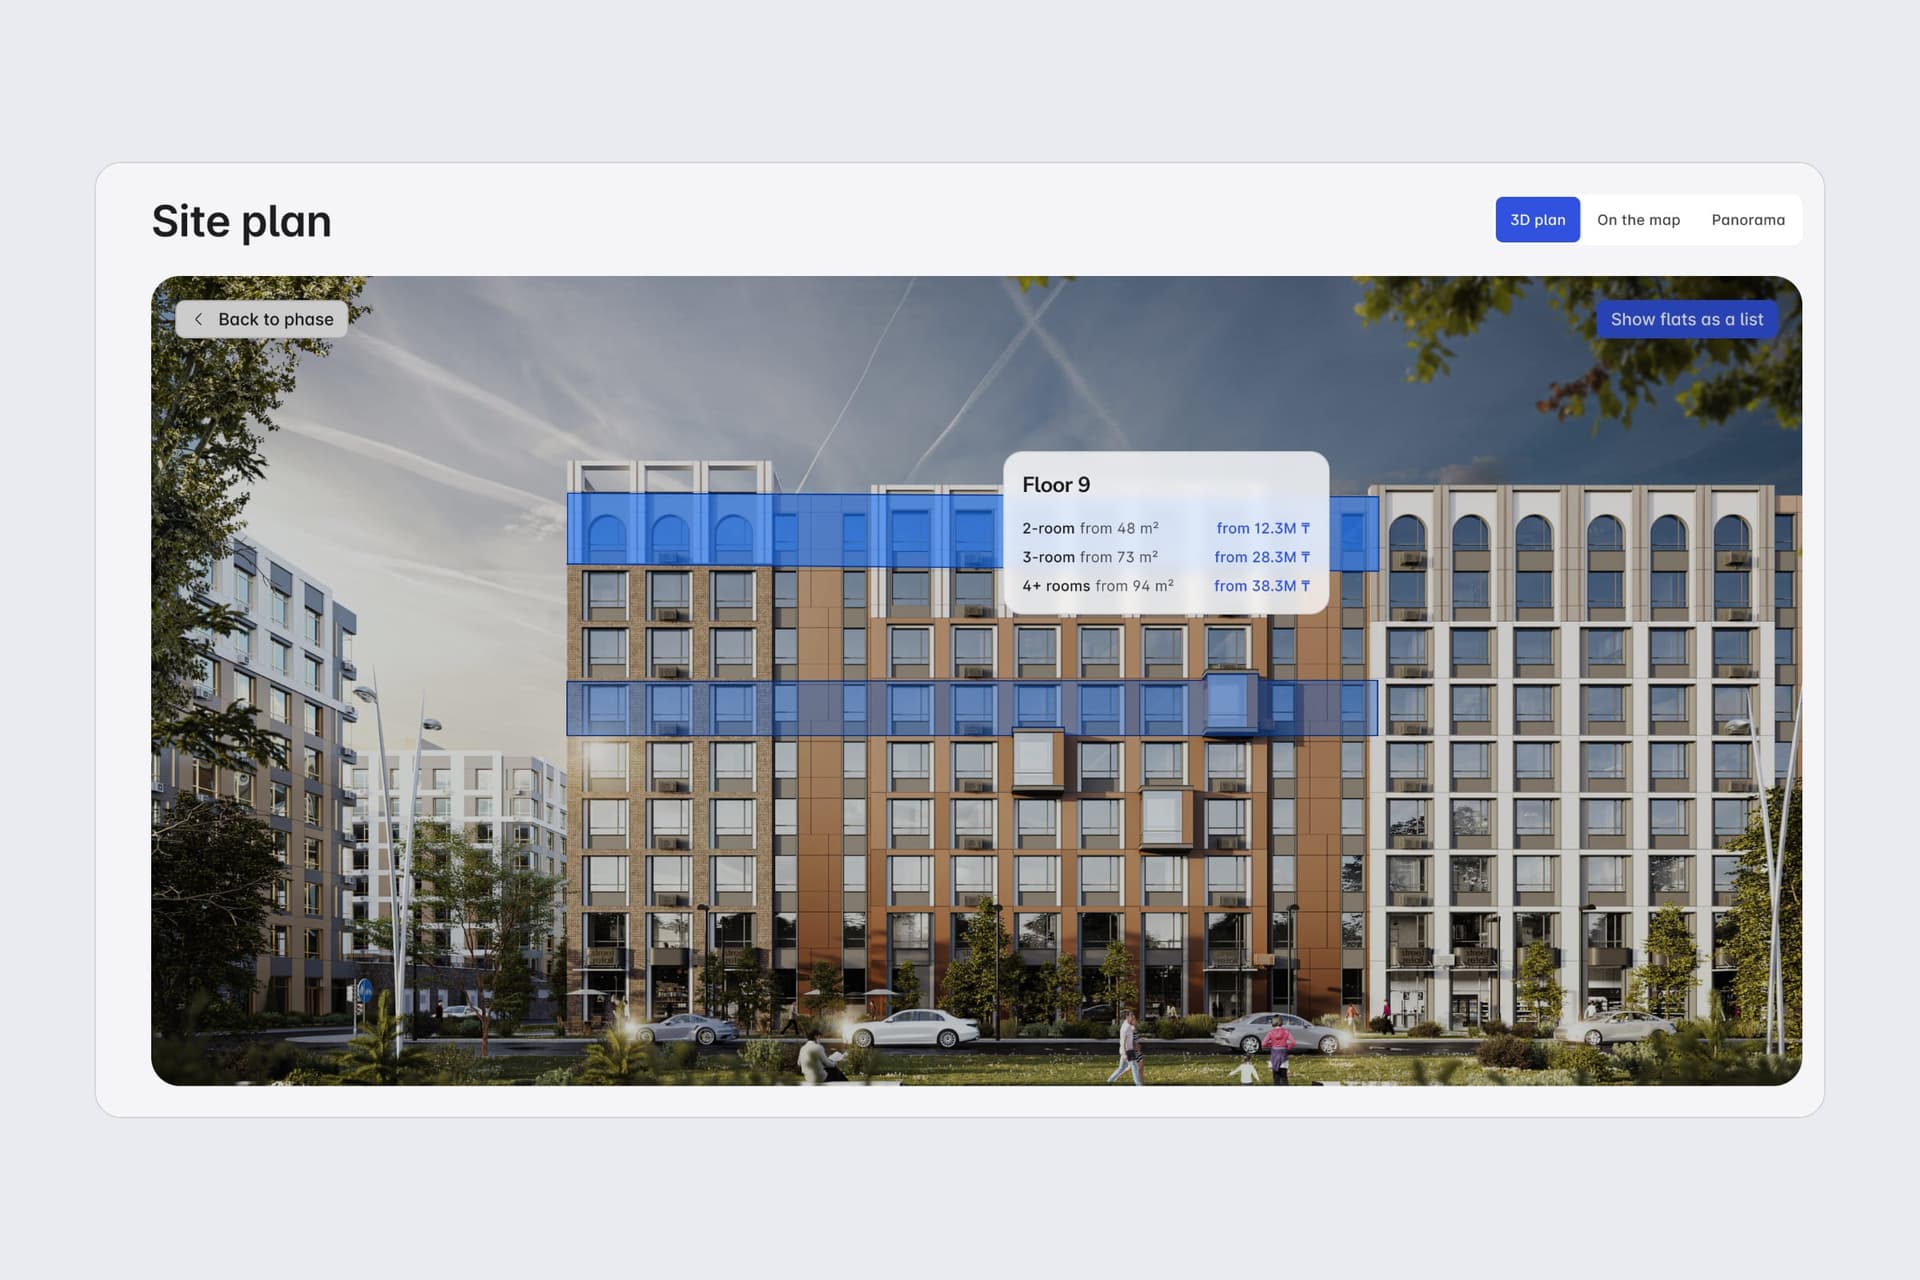
The agents in the 3D group said a client can see which way the windows face. An entrance opens on its façade, floor by floor, with prices for each floor, so the buyer sees which side of the building the flat is on before opening it.
The flat
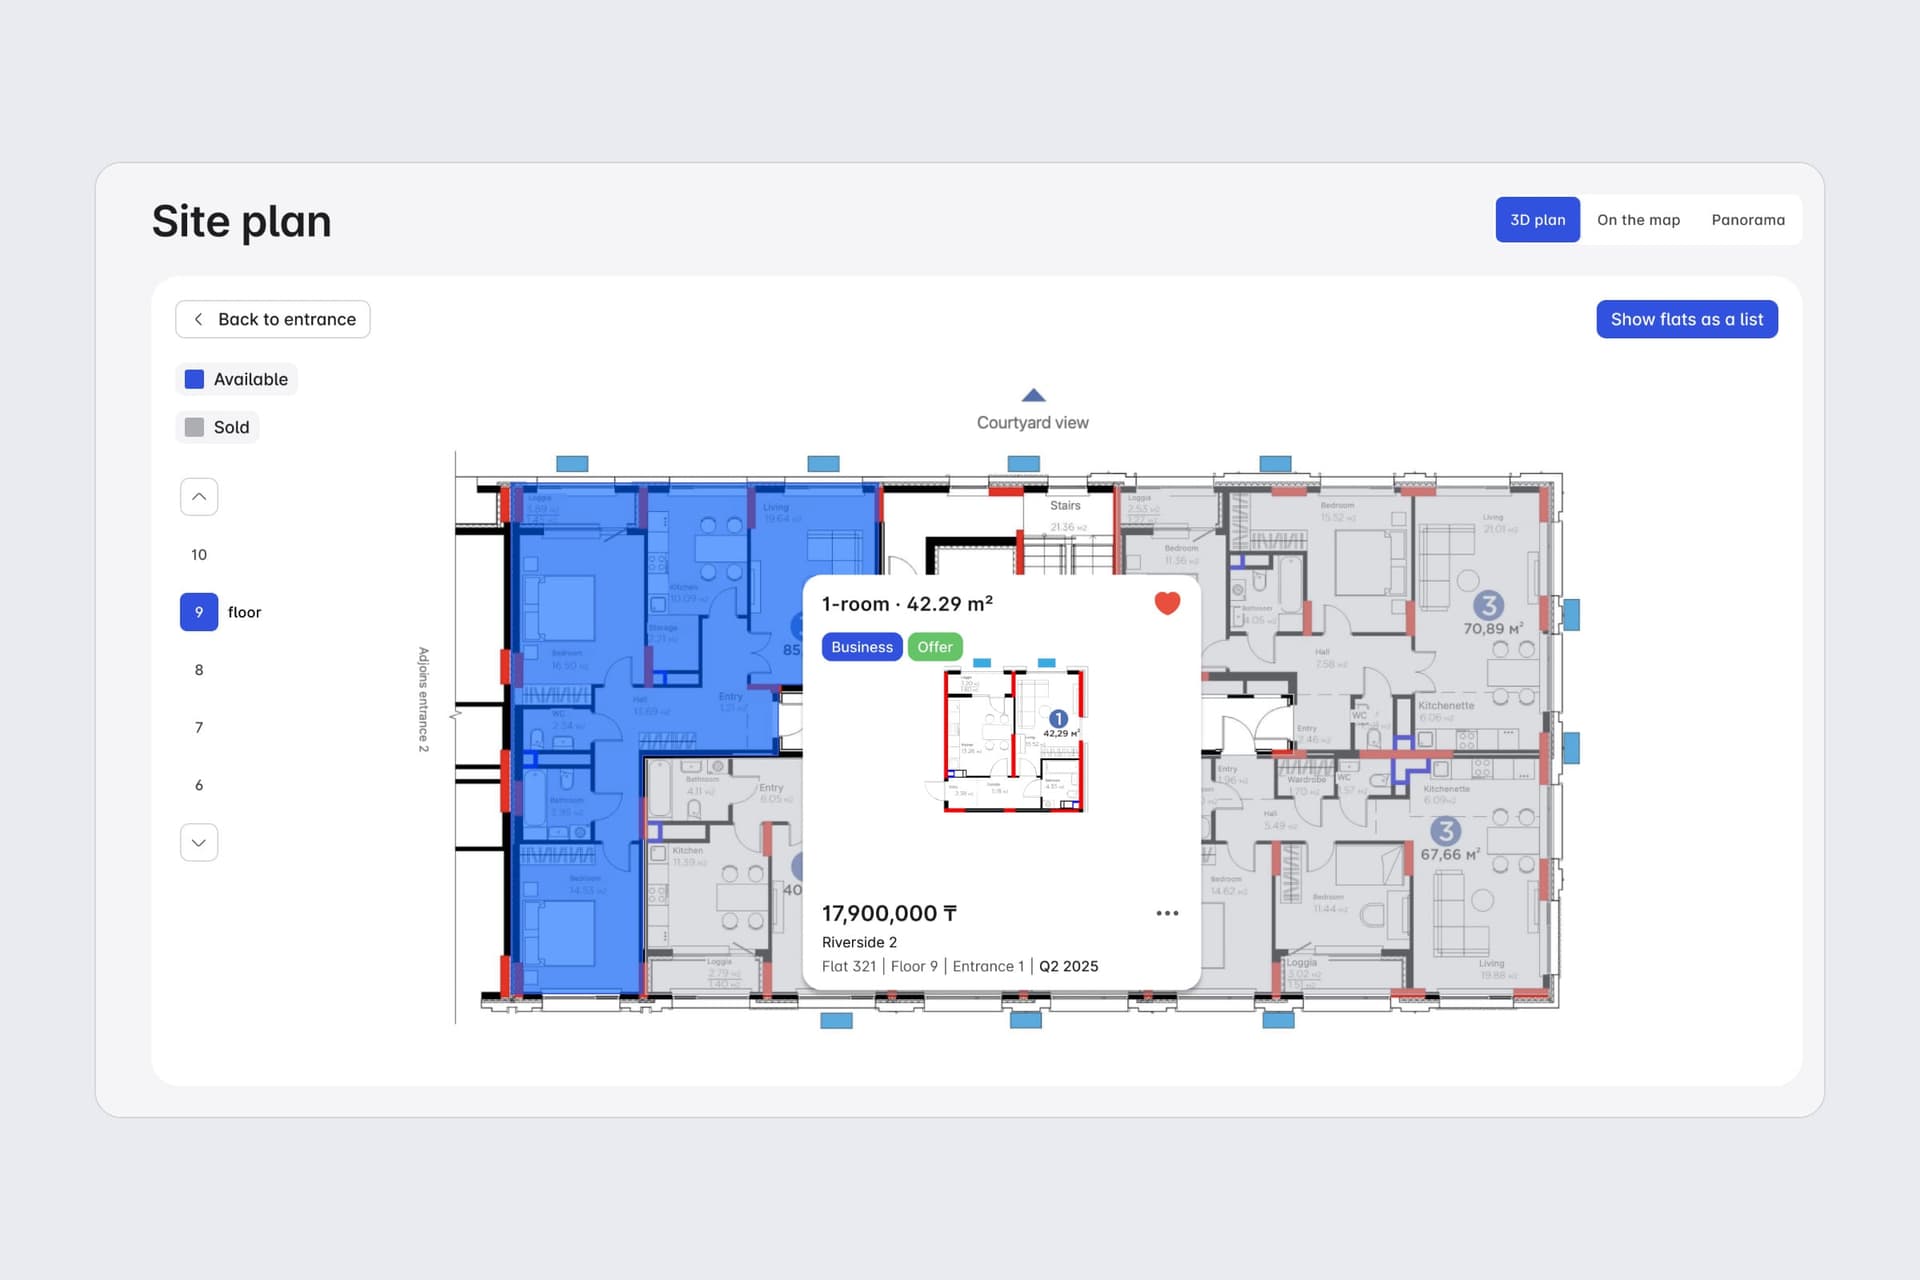
The grid had no floor plan, and 66% of its buyers said it wasn't clear. A floor now opens as its plan, with available and sold flats marked, the courtyard side labelled, and a card for the chosen flat: its layout, price, entrance and handover.
On a phone
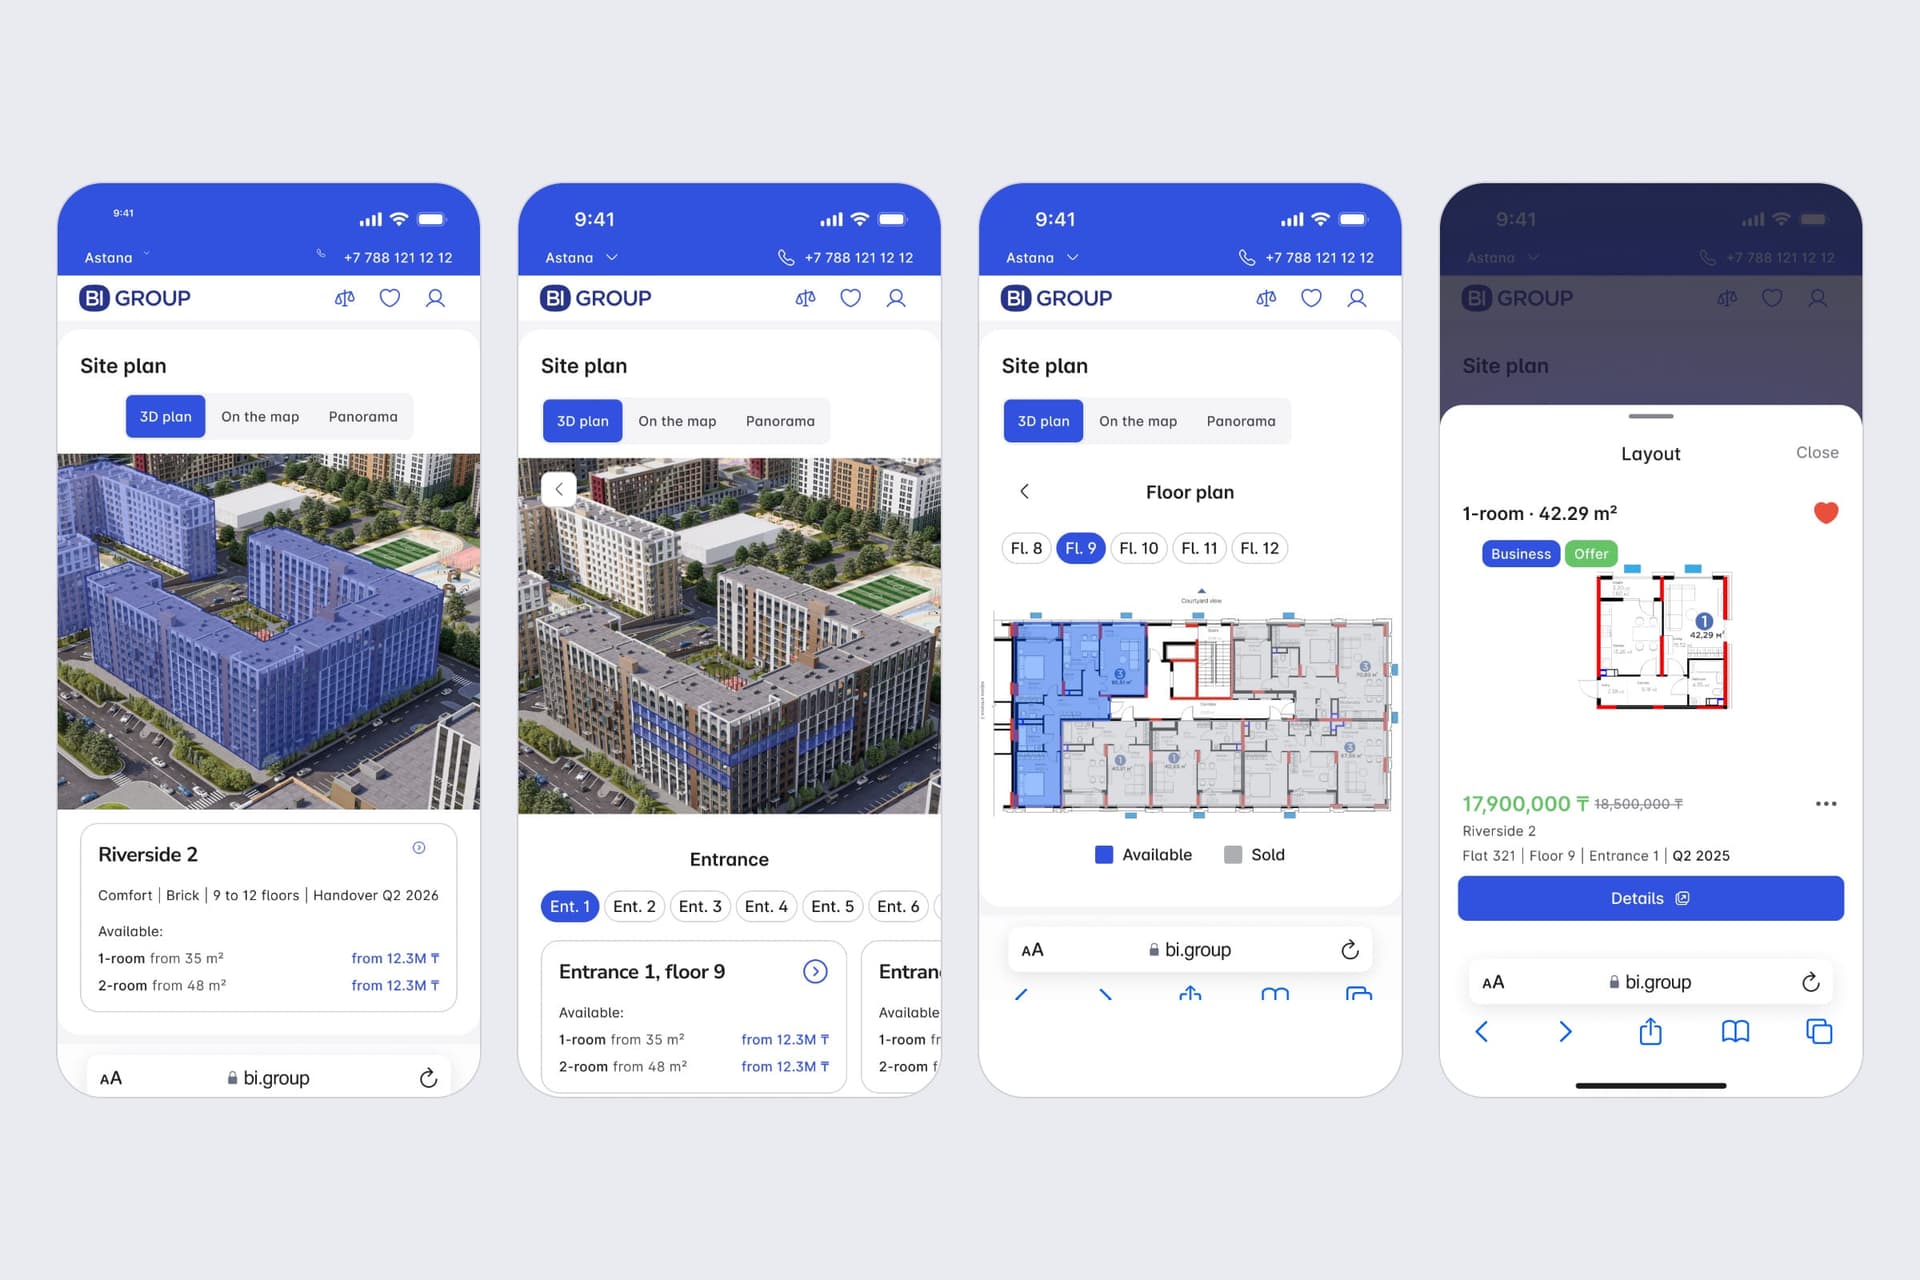
The same four steps fit a phone: the render with the building card under it, entrances as a row of chips, the floor plan with floors as chips, and the flat in a sheet over the plan.
Deliver · Markup tool
How a development gets onto the plan
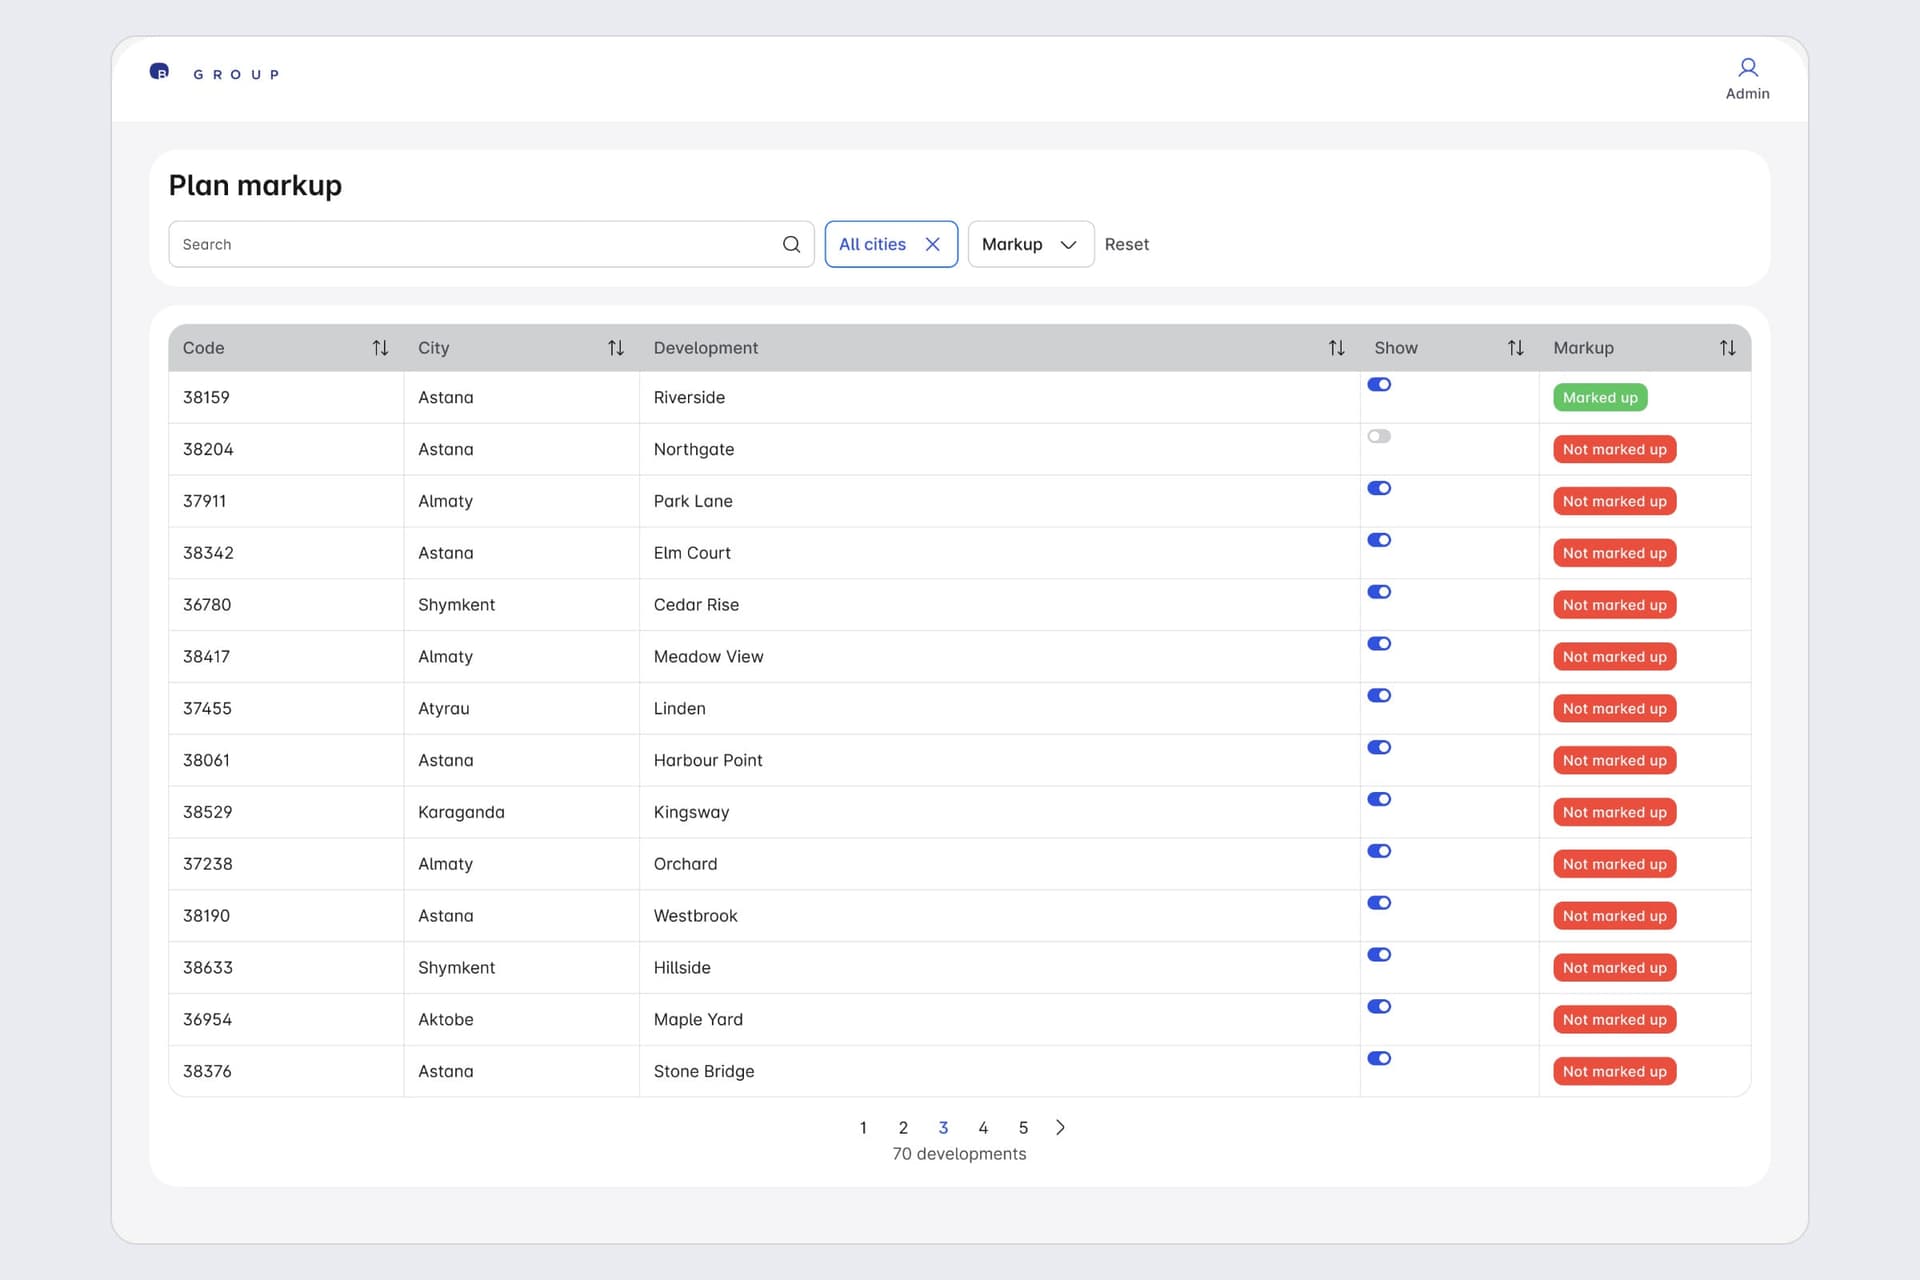
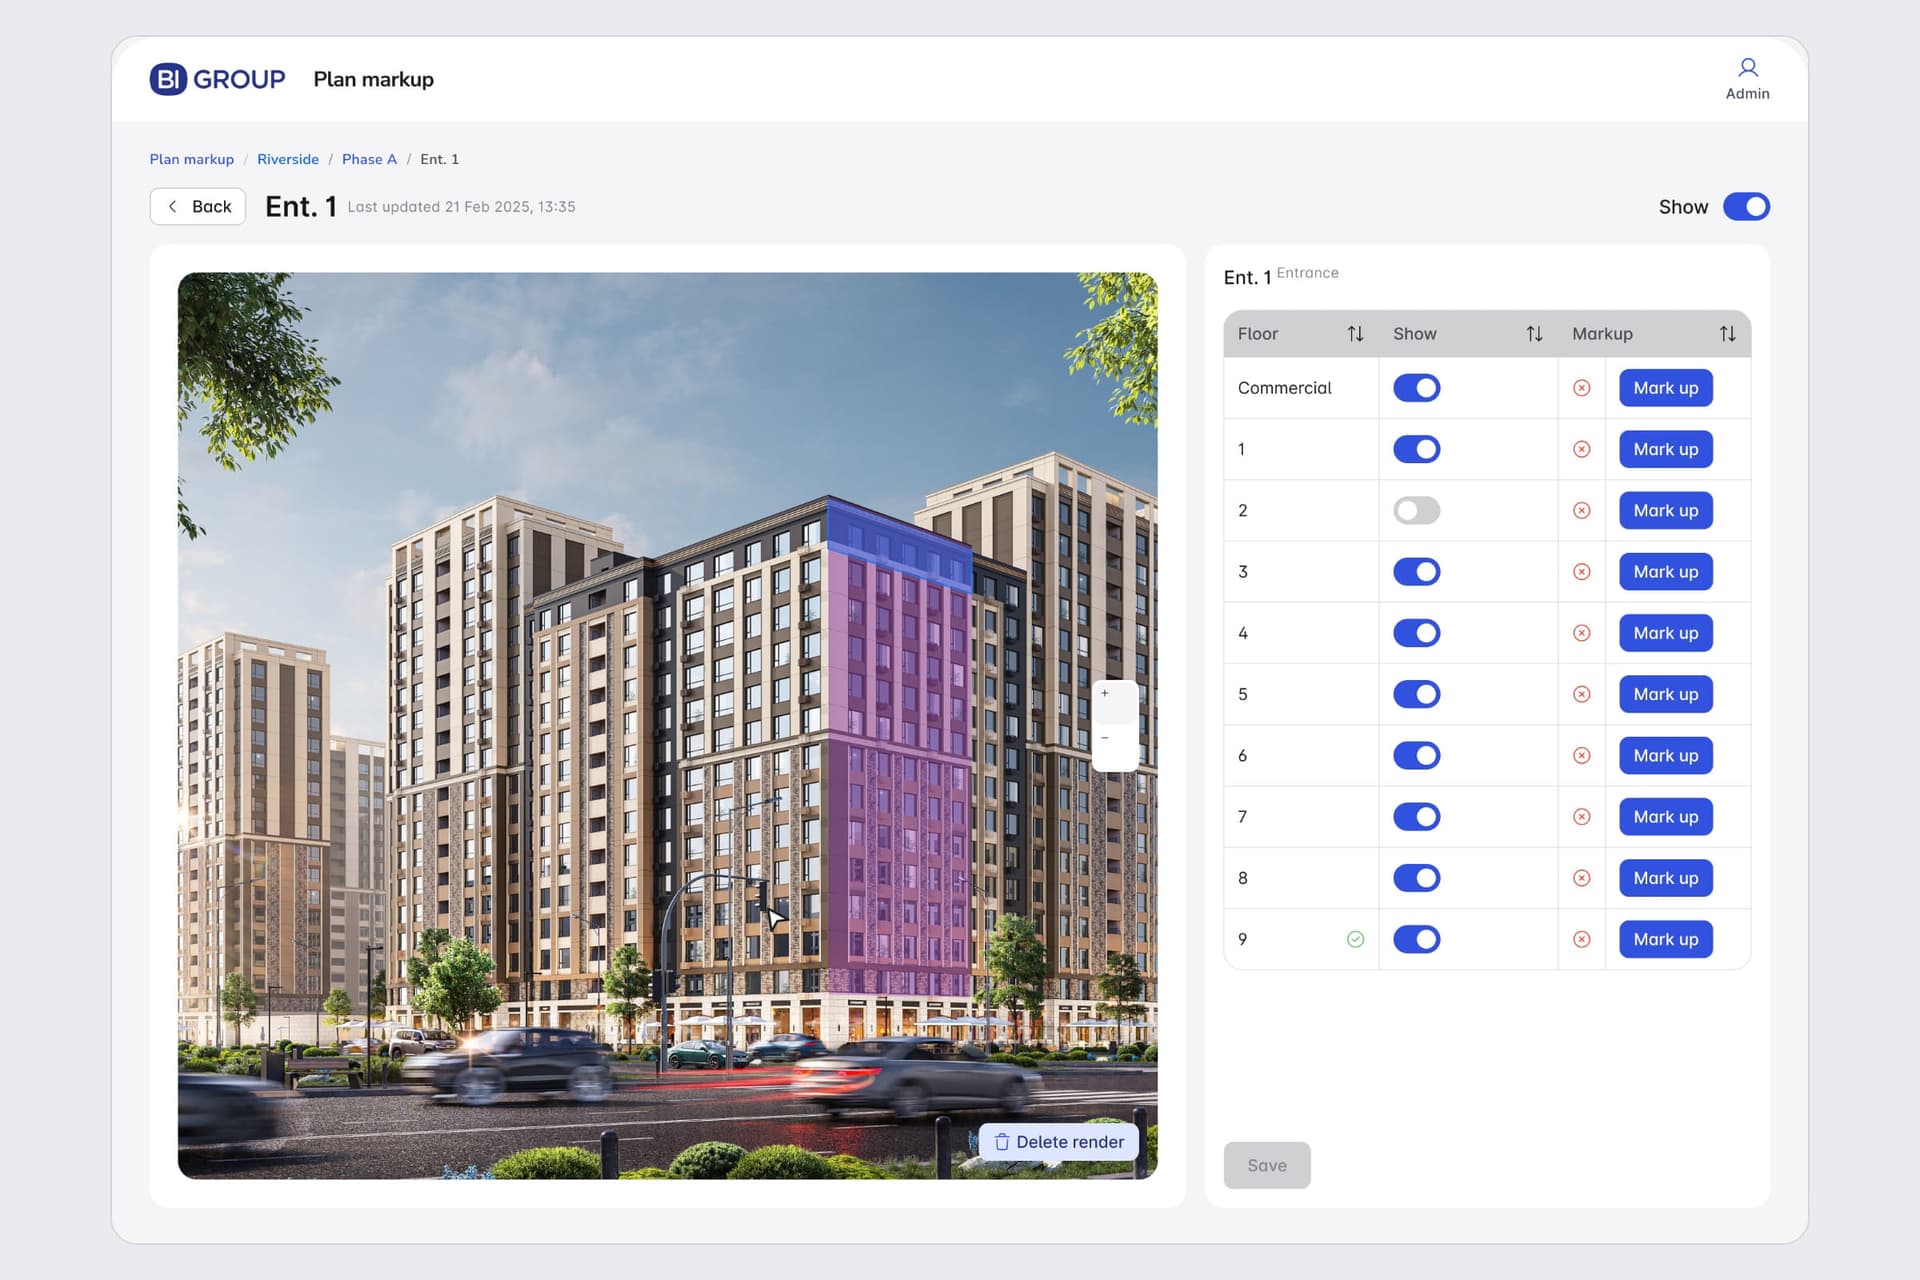
A render only becomes clickable once someone has marked it up. I designed the tool colleagues use for that, and it shipped with the plan. It lists every development with its status, marked up or not, and a switch for whether it shows on the site.
Inside a development, a colleague uploads the site render and outlines each phase on it, then switches each phase on or off. The same pattern repeats one level down: entrances on a phase's render, floors on an entrance's render.
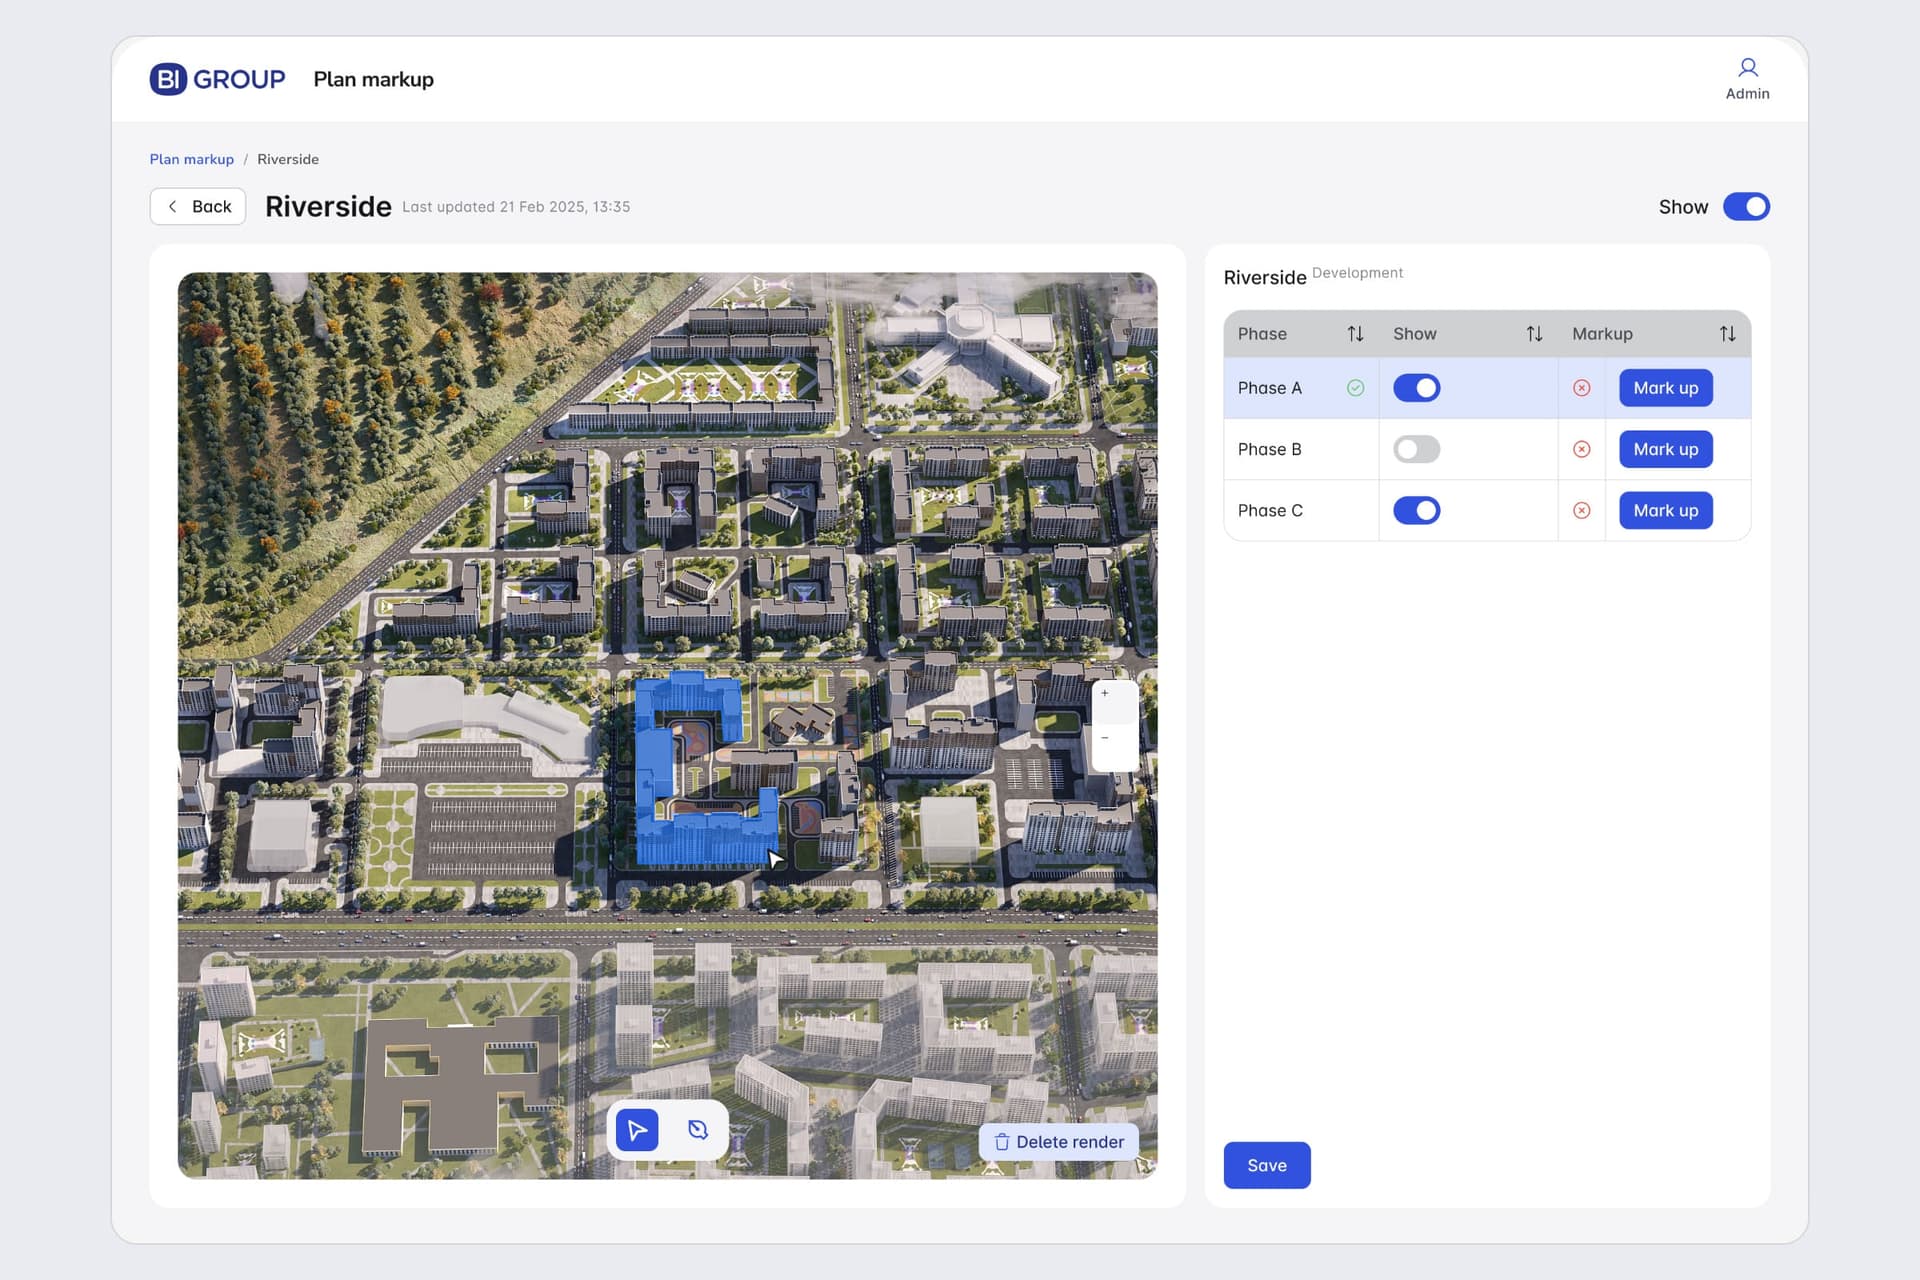
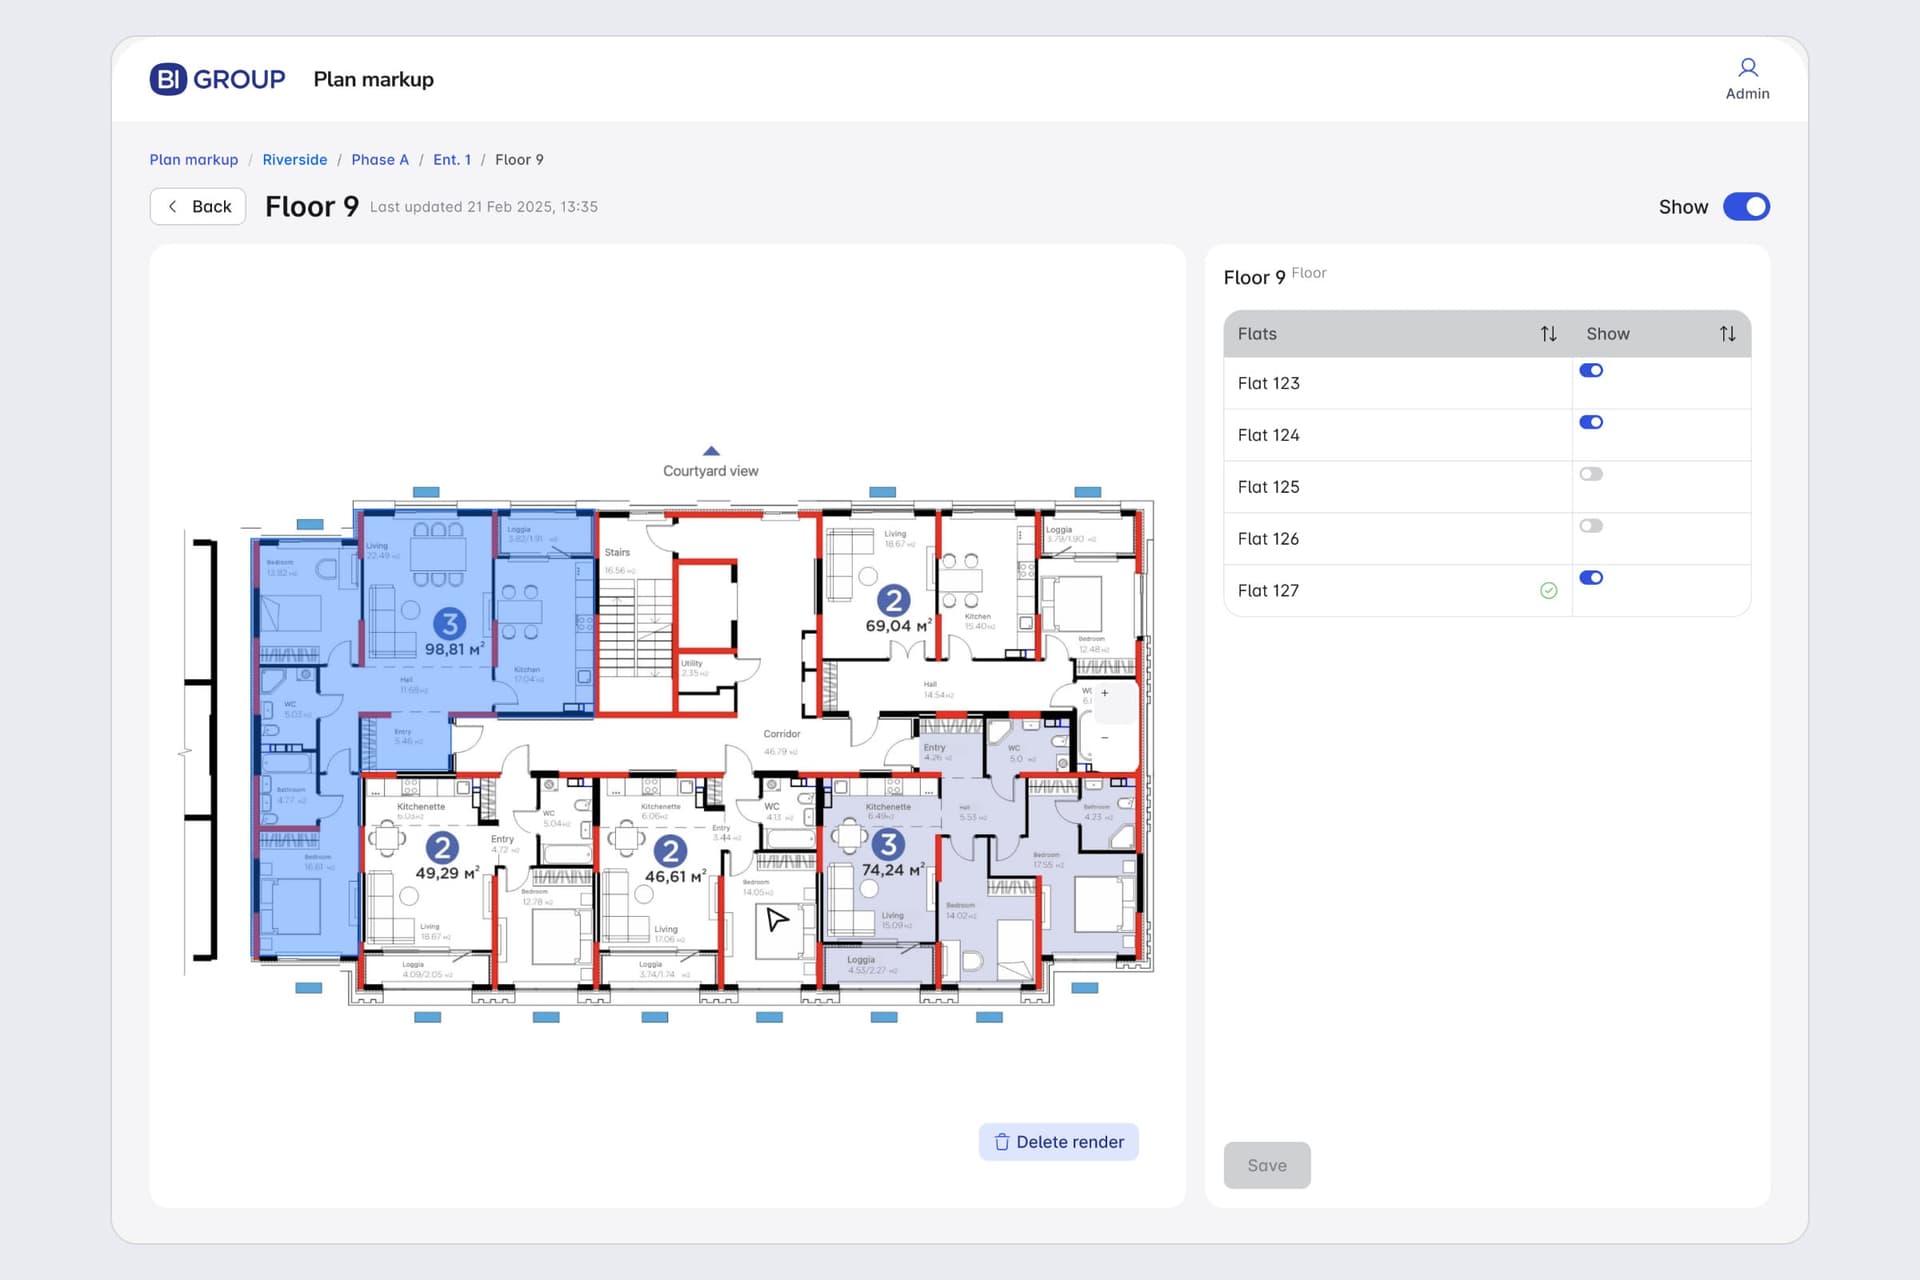
The last level is the floor plan, where each flat is outlined and switched on or off. Buyers walk down the same chain on the site: building, entrance, floor, flat.
Impact · After launch
What the agents said a month later
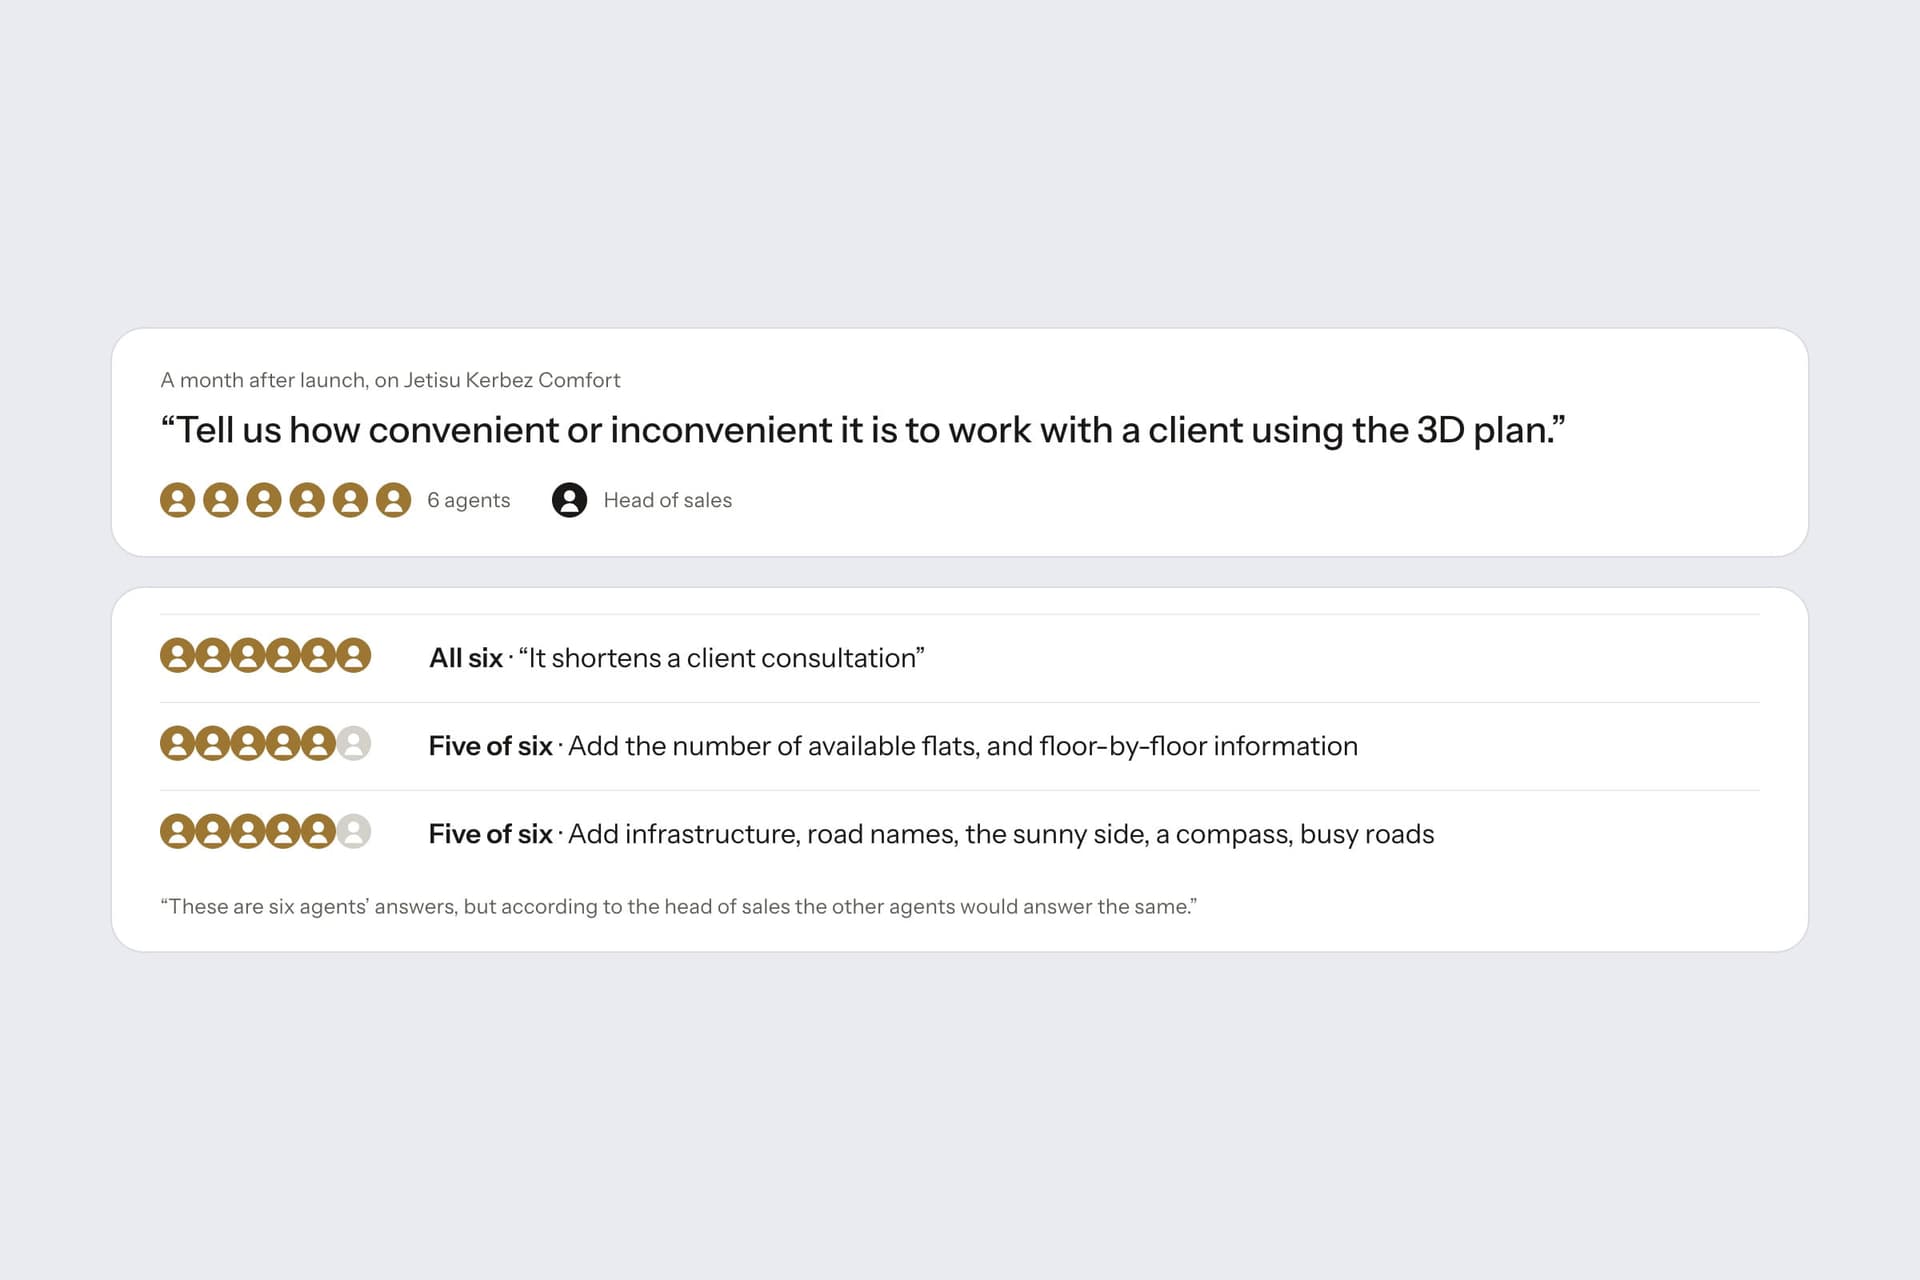
The plan went live on Jetisu Kerbez Comfort. A month after the A/B we went back to the sales floor: the same six agents, three from each group, and the head of sales, and asked how convenient or inconvenient it was to work with a client using it.
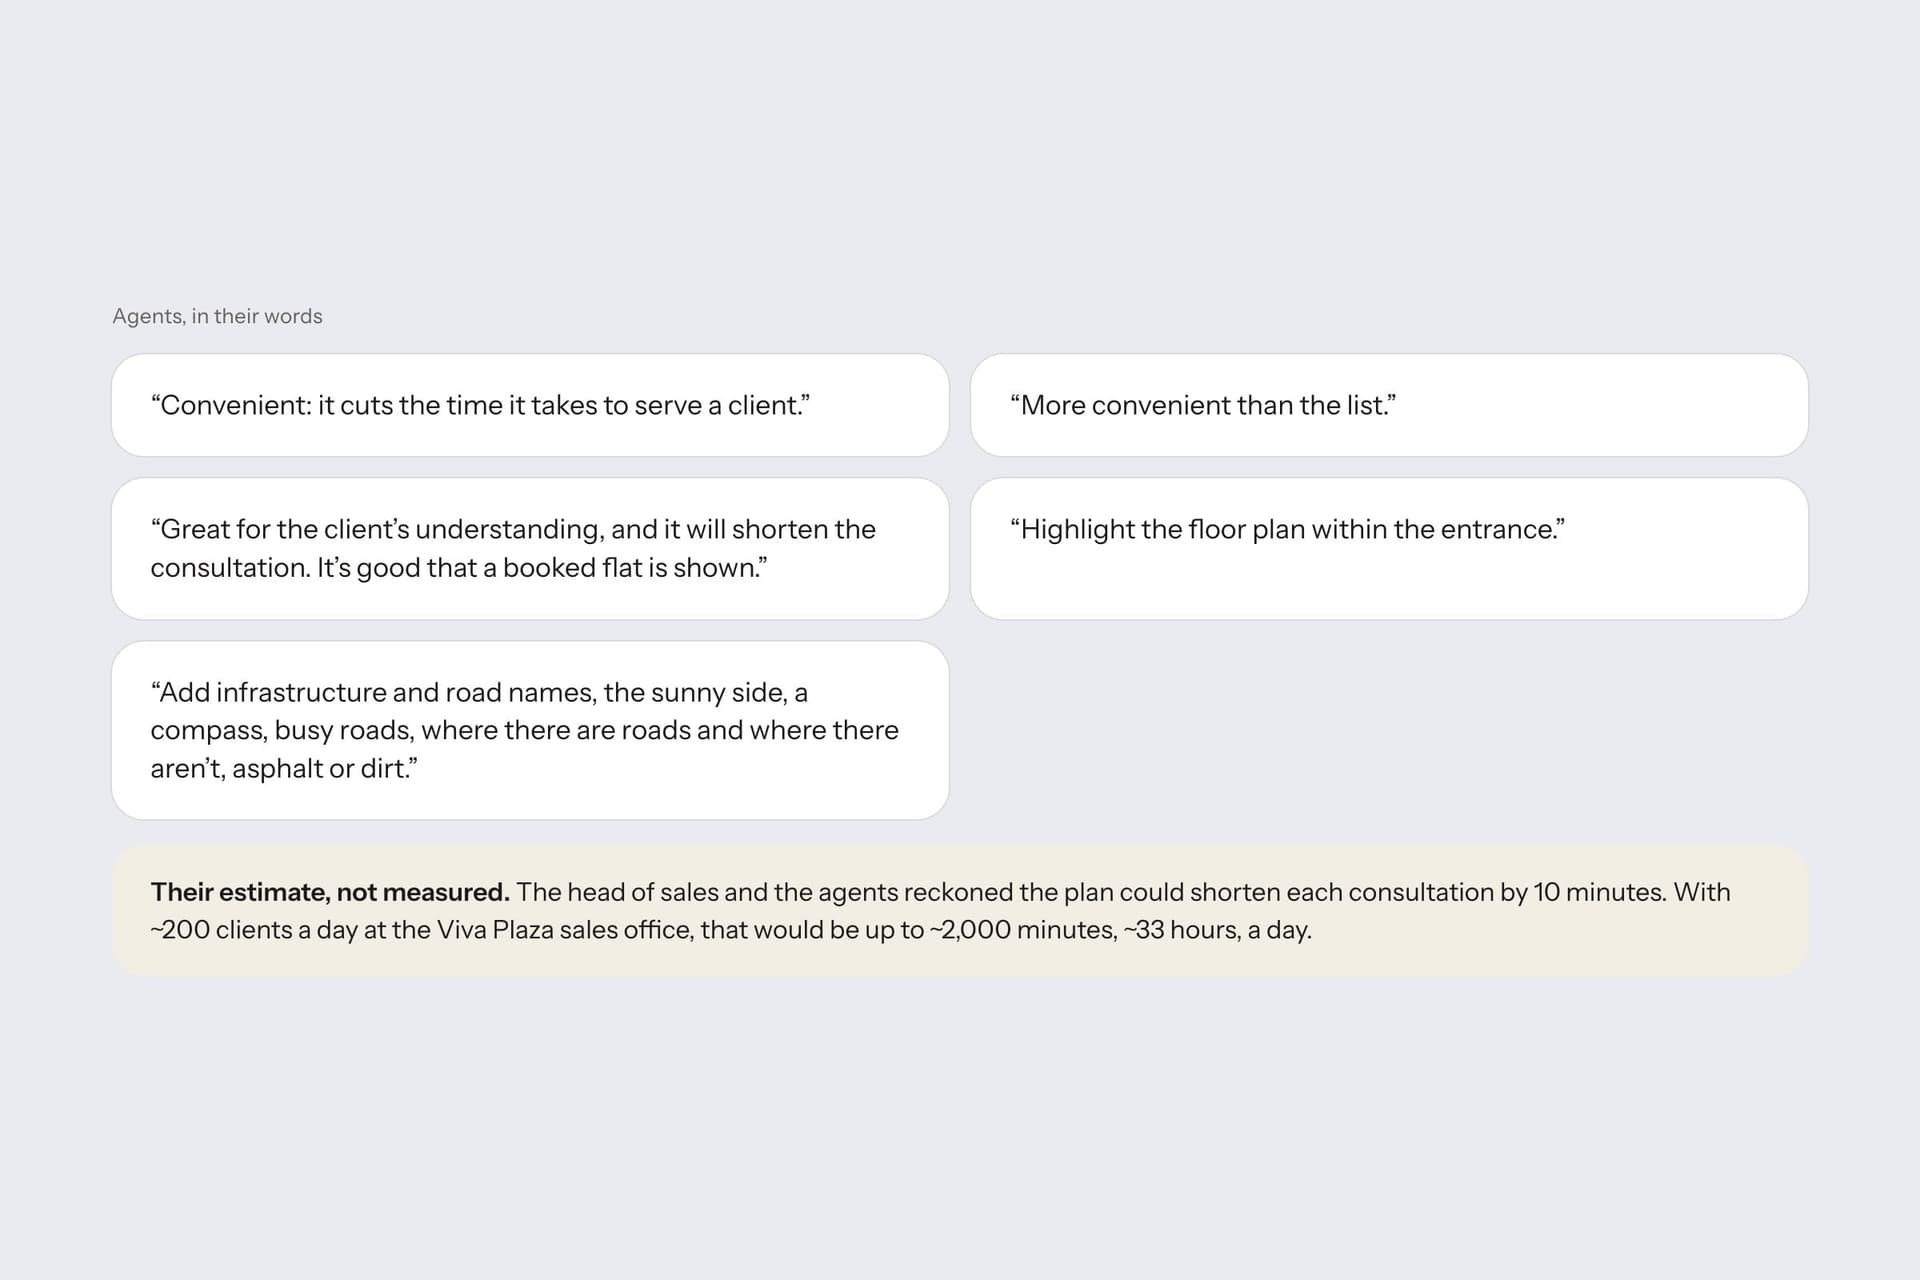
All six agents said it shortens a client consultation, including the three who had preferred the grid. Before launch those three had judged by their own speed. I read the change this way: with a buyer in front of them, the plan does the explaining.
What they asked for next
- Five of six wanted available-flat counts and floor-by-floor information on the plan itself
- Five of six wanted the surroundings: infrastructure, road names, which side gets the sun, a compass, which roads are busy
Both point the same way as the A/B's request for streets and landmarks. The plan answers where a flat sits in a building; what agents ask for next is what it is like to live there.
The projection in the Outcome is their arithmetic: a consultation 10 minutes shorter per client, times about 200 clients a day at the Viva Plaza sales office, comes to at most about 2,000 minutes, about 33 hours, a day.
Reflection
What the studies couldn't tell me
Neither round was sized to measure anything. Twelve people find friction; they don't tell you how much of it there is. I have no post-launch behavioural data on this feature: no completion rate, no time-on-page, nothing from analytics. The evidence that it worked is seven people saying so.
The A/B also compared a prototype against a live page, which flatters the prototype. Nothing was slow, nothing was broken, no real inventory was behind it.
The part I got wrong was reading the grid agents' answer as a verdict on the plan. What they described was their own speed with the grid. Asking them what a client struggles to understand, rather than which interface they preferred, would have got to the same place sooner.